Keith Weiner
My articles My offerMy siteAbout meMy videosMy books
Follow on:LinkedINTwitterSeeking AlphaFacebookAmazonGoogle +
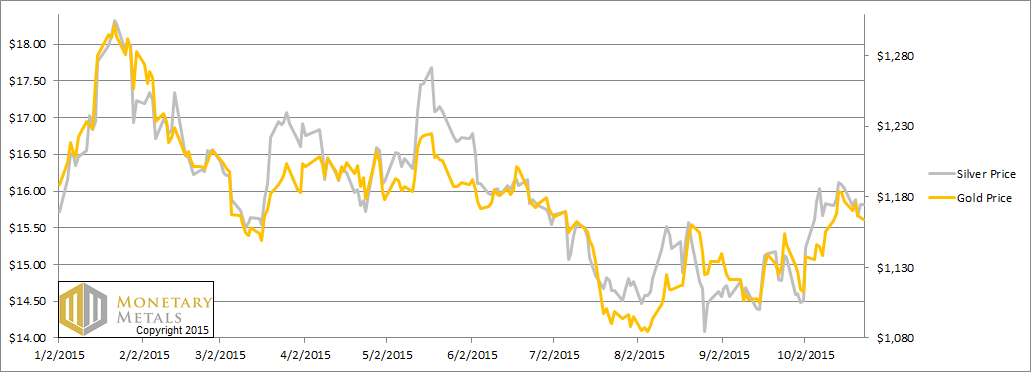
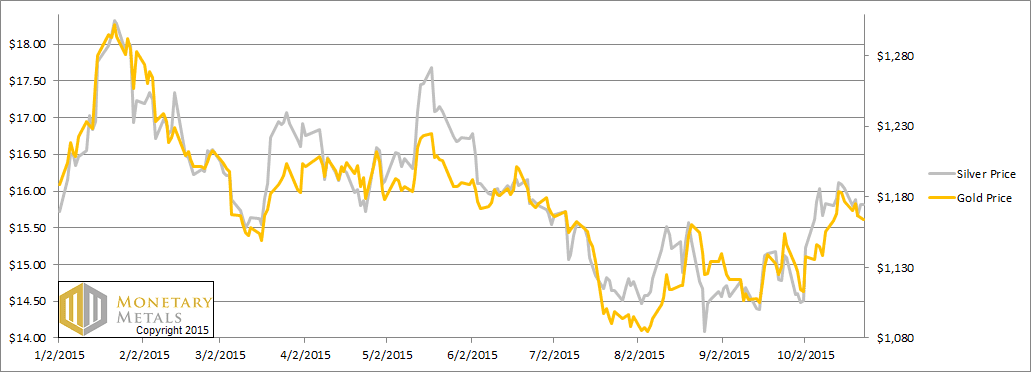
At the risk of being boring, there’s not a lot to say about the markets for gold and silver this week (and frankly being on a challenging travel itinerary, flying from Vienna to Sydney to give a keynote at the Gold Symposium this week, is part of it). There was a modest drop in the prices of the metals, $13 in gold and 21 cents in silver. As it usually does, the silver price moved more than the gold price.
Of course, it’s only boring if you aren’t in the markets. If you are then quiet weeks are OK, but you still pay attention.
It’s the basis that tells us what this means, if anything.
Read on for the picture of supply and demand fundamentals…
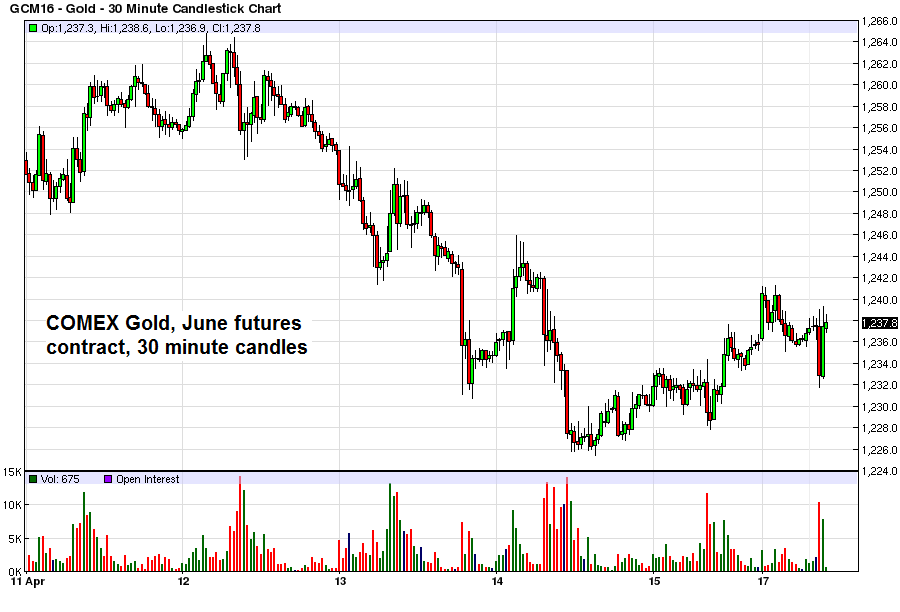
First, here is the graph of the metals’ prices.
The Prices of Gold and Silver
 We are interested in the changing equilibrium created when some market participants are accumulating hoards and others are dishoarding. Of course, what makes it exciting is that speculators can (temporarily) exaggerate or fight against the trend. The speculators are often acting on rumors, technical analysis, or partial data about flows into or out of one corner of the market. That kind of information can’t tell them whether the globe, on net, is hoarding or dishoarding.
One could point out that gold does not, on net, go into or out of anything. Yes, that is true. But it can come out of hoards and into carry trades. That is what we study. The gold basis tells us about this dynamic.
Conventional techniques for analyzing supply and demand are inapplicable to gold and silver, because the monetary metals have such high inventories. In normal commodities, inventories divided by annual production (stocks to flows) can be measured in months. The world just does not keep much inventory in wheat or oil.
With gold and silver, stocks to flows is measured in decades. Every ounce of those massive stockpiles is potential supply. Everyone on the planet is potential demand. At the right price, and under the right conditions. Looking at incremental changes in mine output or electronic manufacturing is not helpful to predict the future prices of the metals. For an introduction and guide to our concepts and theory, click here.
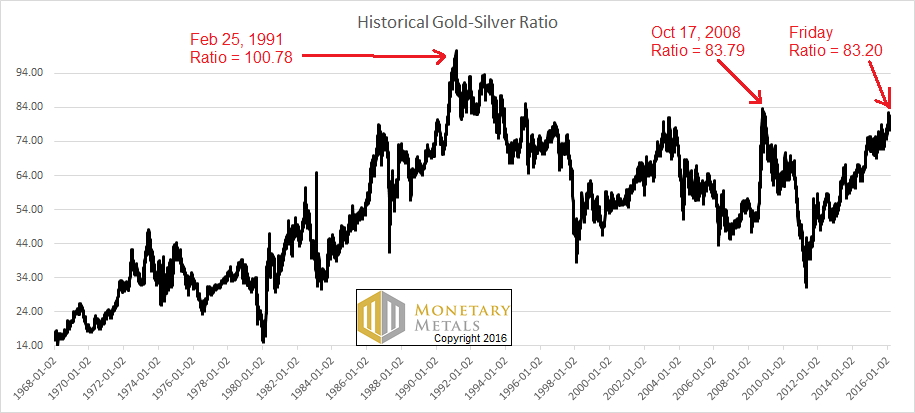
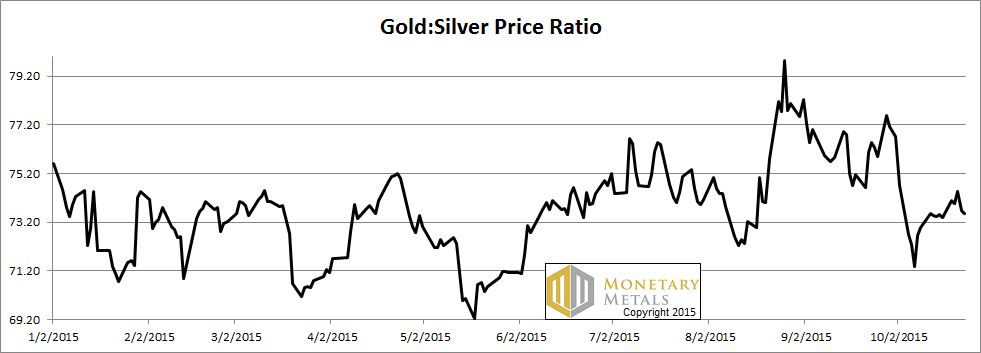
Next, this is a graph of the gold price measured in silver, otherwise known as the gold to silver ratio. The ratio moved up slightly this week.
The Ratio of the Gold Price to the Silver Price
We are interested in the changing equilibrium created when some market participants are accumulating hoards and others are dishoarding. Of course, what makes it exciting is that speculators can (temporarily) exaggerate or fight against the trend. The speculators are often acting on rumors, technical analysis, or partial data about flows into or out of one corner of the market. That kind of information can’t tell them whether the globe, on net, is hoarding or dishoarding.
One could point out that gold does not, on net, go into or out of anything. Yes, that is true. But it can come out of hoards and into carry trades. That is what we study. The gold basis tells us about this dynamic.
Conventional techniques for analyzing supply and demand are inapplicable to gold and silver, because the monetary metals have such high inventories. In normal commodities, inventories divided by annual production (stocks to flows) can be measured in months. The world just does not keep much inventory in wheat or oil.
With gold and silver, stocks to flows is measured in decades. Every ounce of those massive stockpiles is potential supply. Everyone on the planet is potential demand. At the right price, and under the right conditions. Looking at incremental changes in mine output or electronic manufacturing is not helpful to predict the future prices of the metals. For an introduction and guide to our concepts and theory, click here.
Next, this is a graph of the gold price measured in silver, otherwise known as the gold to silver ratio. The ratio moved up slightly this week.
The Ratio of the Gold Price to the Silver Price
 For each metal, we will look at a graph of the basis and cobasis overlaid with the price of the dollar in terms of the respective metal. It will make it easier to provide brief commentary. The dollar will be represented in green, the basis in blue and cobasis in red.
Here is the gold graph.
The Gold Basis and Cobasis and the Dollar Price
For each metal, we will look at a graph of the basis and cobasis overlaid with the price of the dollar in terms of the respective metal. It will make it easier to provide brief commentary. The dollar will be represented in green, the basis in blue and cobasis in red.
Here is the gold graph.
The Gold Basis and Cobasis and the Dollar Price
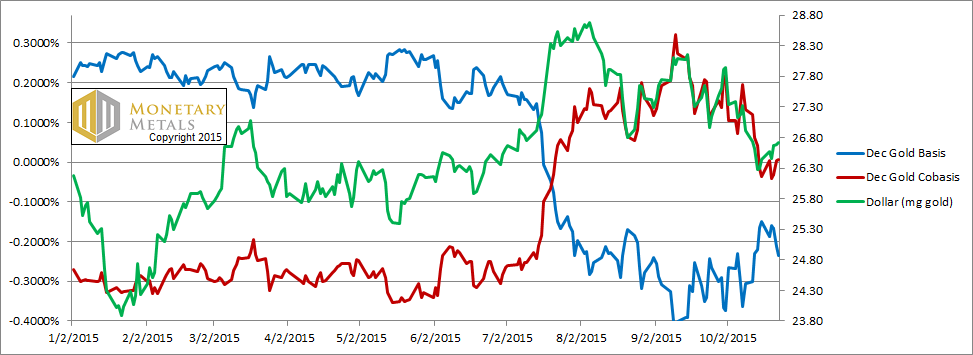 Still the scarcity of gold tracks the price of the dollar in gold.
Our calculated fundamental price barely budged, and is now $100 over the market price.
Now let’s look at silver.
The Silver Basis and Cobasis and the Dollar Price
Still the scarcity of gold tracks the price of the dollar in gold.
Our calculated fundamental price barely budged, and is now $100 over the market price.
Now let’s look at silver.
The Silver Basis and Cobasis and the Dollar Price
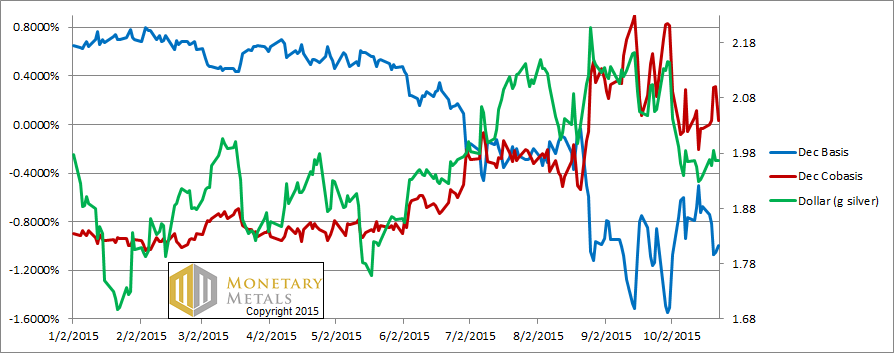 The price of the dollar in silver terms rose. But the scarcity of silver did not move proportionally.
Alas, for any hapless silver bettors out there (not Monetary Metals readers, we trust!) the fundamental price dropped slightly more than the market price.
© 2015 Monetary Metals
The price of the dollar in silver terms rose. But the scarcity of silver did not move proportionally.
Alas, for any hapless silver bettors out there (not Monetary Metals readers, we trust!) the fundamental price dropped slightly more than the market price.
© 2015 Monetary Metals
Full story here
Are you the author?
 We are interested in the changing equilibrium created when some market participants are accumulating hoards and others are dishoarding. Of course, what makes it exciting is that speculators can (temporarily) exaggerate or fight against the trend. The speculators are often acting on rumors, technical analysis, or partial data about flows into or out of one corner of the market. That kind of information can’t tell them whether the globe, on net, is hoarding or dishoarding.
One could point out that gold does not, on net, go into or out of anything. Yes, that is true. But it can come out of hoards and into carry trades. That is what we study. The gold basis tells us about this dynamic.
Conventional techniques for analyzing supply and demand are inapplicable to gold and silver, because the monetary metals have such high inventories. In normal commodities, inventories divided by annual production (stocks to flows) can be measured in months. The world just does not keep much inventory in wheat or oil.
With gold and silver, stocks to flows is measured in decades. Every ounce of those massive stockpiles is potential supply. Everyone on the planet is potential demand. At the right price, and under the right conditions. Looking at incremental changes in mine output or electronic manufacturing is not helpful to predict the future prices of the metals. For an introduction and guide to our concepts and theory, click here.
Next, this is a graph of the gold price measured in silver, otherwise known as the gold to silver ratio. The ratio moved up slightly this week.
The Ratio of the Gold Price to the Silver Price
We are interested in the changing equilibrium created when some market participants are accumulating hoards and others are dishoarding. Of course, what makes it exciting is that speculators can (temporarily) exaggerate or fight against the trend. The speculators are often acting on rumors, technical analysis, or partial data about flows into or out of one corner of the market. That kind of information can’t tell them whether the globe, on net, is hoarding or dishoarding.
One could point out that gold does not, on net, go into or out of anything. Yes, that is true. But it can come out of hoards and into carry trades. That is what we study. The gold basis tells us about this dynamic.
Conventional techniques for analyzing supply and demand are inapplicable to gold and silver, because the monetary metals have such high inventories. In normal commodities, inventories divided by annual production (stocks to flows) can be measured in months. The world just does not keep much inventory in wheat or oil.
With gold and silver, stocks to flows is measured in decades. Every ounce of those massive stockpiles is potential supply. Everyone on the planet is potential demand. At the right price, and under the right conditions. Looking at incremental changes in mine output or electronic manufacturing is not helpful to predict the future prices of the metals. For an introduction and guide to our concepts and theory, click here.
Next, this is a graph of the gold price measured in silver, otherwise known as the gold to silver ratio. The ratio moved up slightly this week.
The Ratio of the Gold Price to the Silver Price
 For each metal, we will look at a graph of the basis and cobasis overlaid with the price of the dollar in terms of the respective metal. It will make it easier to provide brief commentary. The dollar will be represented in green, the basis in blue and cobasis in red.
Here is the gold graph.
The Gold Basis and Cobasis and the Dollar Price
For each metal, we will look at a graph of the basis and cobasis overlaid with the price of the dollar in terms of the respective metal. It will make it easier to provide brief commentary. The dollar will be represented in green, the basis in blue and cobasis in red.
Here is the gold graph.
The Gold Basis and Cobasis and the Dollar Price
 Still the scarcity of gold tracks the price of the dollar in gold.
Our calculated fundamental price barely budged, and is now $100 over the market price.
Now let’s look at silver.
The Silver Basis and Cobasis and the Dollar Price
Still the scarcity of gold tracks the price of the dollar in gold.
Our calculated fundamental price barely budged, and is now $100 over the market price.
Now let’s look at silver.
The Silver Basis and Cobasis and the Dollar Price
 The price of the dollar in silver terms rose. But the scarcity of silver did not move proportionally.
Alas, for any hapless silver bettors out there (not Monetary Metals readers, we trust!) the fundamental price dropped slightly more than the market price.
© 2015 Monetary Metals
The price of the dollar in silver terms rose. But the scarcity of silver did not move proportionally.
Alas, for any hapless silver bettors out there (not Monetary Metals readers, we trust!) the fundamental price dropped slightly more than the market price.
© 2015 Monetary Metals
Keith Weiner is president of the Gold Standard Institute USA in Phoenix, Arizona, and CEO of the precious metals fund manager Monetary Metals.
Tags: Gold-Cobasis