Tag Archive: Trade
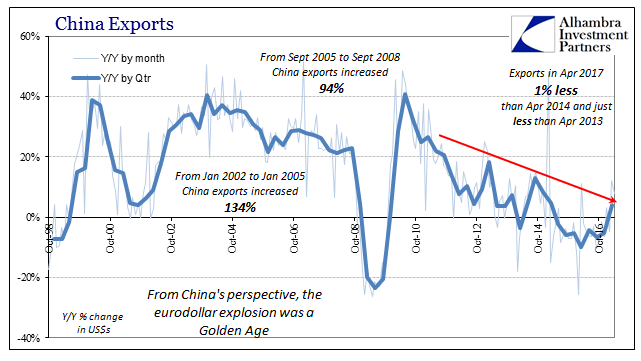
Lackluster Trade, China April Edition
China’s trade statistics for April 2017 uniformly disappointed. They only did so, however, because expectations are being calibrated as if the current economy is actually different. It is instead merely swinging between bouts of contraction and low-grade growth, but so low-grade it really doesn’t qualify as growth.
Read More »
Read More »
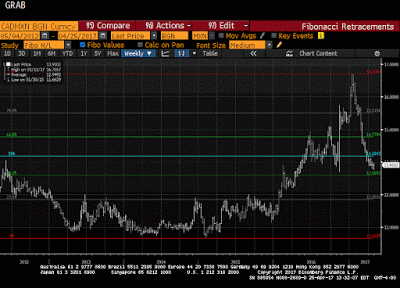
NAFTA Trade Update
The trade tensions between the US and Canada set the Canadian dollar to lows for the year. The dollar's downside momentum against the Mexican peso has eased. The Canadian dollar looks attractive not against the US dollar but against the peso.
Read More »
Read More »
More Thinking about Trade as Pence and Ross Head to Tokyo
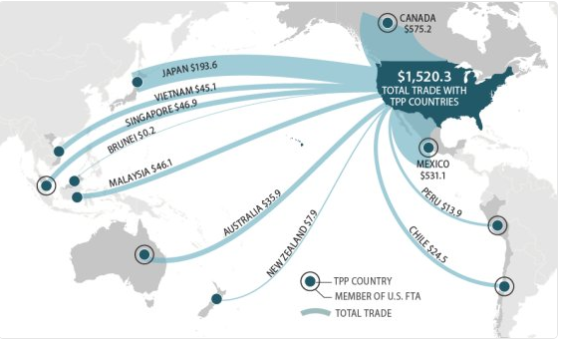
Pence and Ross may "feel out" Abe for interest in a bilateral trade agreement. The US enjoys a small trade surplus with countries it has free-trade agreements. Ownership-based framework of the current account and value-added trade suggest the US trade imbalance is not a significant problem.
Read More »
Read More »
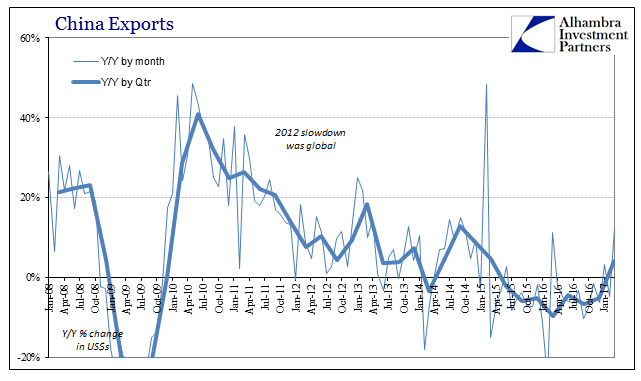
What Was Chinese Trade in March?
As with all statistics, there are discrepancies that from time to time may obscure the meaning or validity of the particular estimate in question. For the vast majority of the time, any such uncertainties amount to very little. Overall, harmony among the major accounts reduces the signal noise from any one featuring a significant inconsistency.
Read More »
Read More »
Trade Notes: China and Prospects for a New Executive Order
China's trade concessions seem modest, but little discussion of US concessions. Reports suggest Trump is set to sign a new executive order to investigate trade practices in steel, aluminum, and maybe household appliances. Trade imbalances and floating currencies are not mutually exclusive.
Read More »
Read More »
Five Keys to Understand Trump
The election of Donald Trump as the 45th President of the United States surprised many people, even seasoned political observers and astute investors. He failed to win the popular vote but did carry the electoral college, which is how the US elects its chief executive. His victory is a bit of a Rorshcach test, where people project the issues that allowed Trump to succeed, with different observers making different claims.
Read More »
Read More »
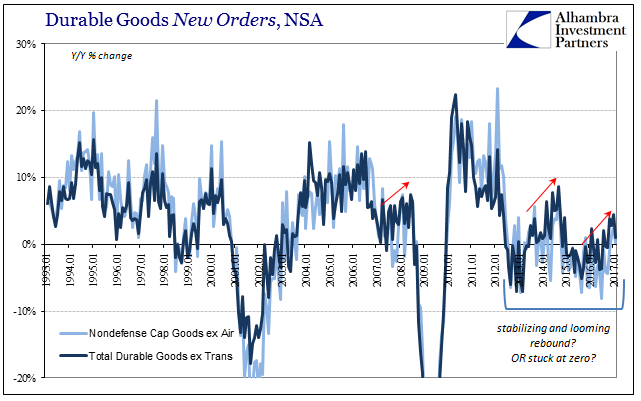
Durable Goods After Leap Year
New orders for durable goods (not including transportation orders) were up 1% year-over-year in February. That is less than the (revised) 4.4% growth in January, but as with all comparisons of February 2017 to February 2016 there will be some uncertainty surrounding the comparison to the leap year version.
Read More »
Read More »
US Trade Skews
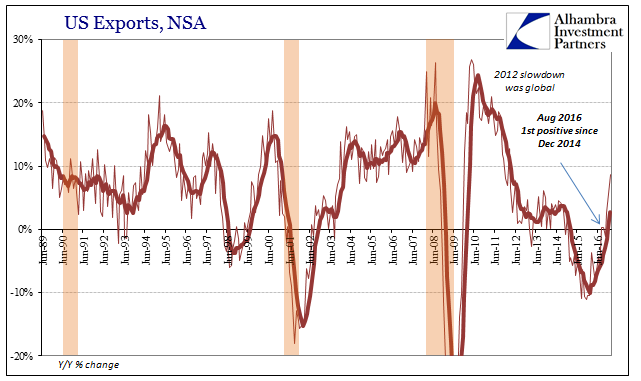
US trade statistics dramatically improved in January 2017, though questions remain as to interpreting by how much. On the export side, US exports of goods rose 8.7% year-over-year (NSA). While that was the highest growth rate since 2012, there is part symmetry to account for some of it.
Read More »
Read More »
The Misplaced Animosity toward Imports
Pity imports, they are misunderstood. Imports create jobs directly and indirectly. Restricting US imports would likely also curb exports.
Read More »
Read More »
Trade is Trump’s Centerpiece
Investors are anxiously awaiting more details on the new US Administration's economic policies and priorities. Part of the challenge is that the cabinet represents a wide range of views and it is not clear where the informal power lies, or whose call is it. In terms of economic policy, trade is being given priority. It is seen as the key to the jobs and growth objectives.
Read More »
Read More »
Great Graphic: How a Strong Dollar Weighs on Net Exports
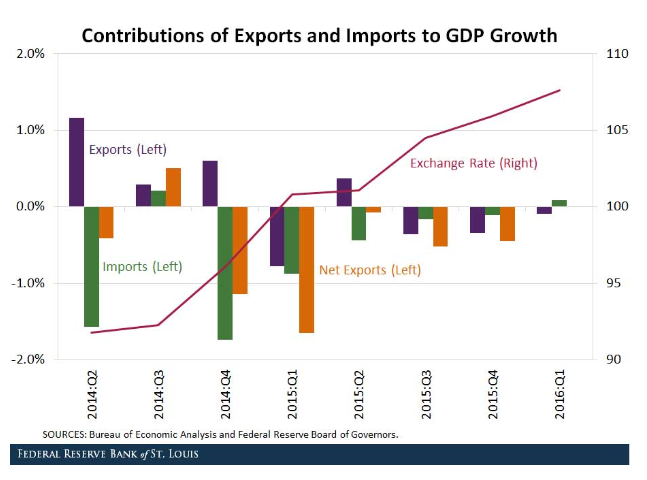
Investors appreciate that a strong dollar can impact US growth through the net export component of GDP. The dollar's appreciation can push up the price of exports and lower the cost of imports. The St. Louis Fed took a look at how the strong dollar from 2014 to the beginning of 2016 impacted the net export function of GDP.
Read More »
Read More »
Great Graphic: Trade and Tariffs-End of an Era?
This Great Graphic was tweeted by the Financial Time's John Authers, who got it from @fathomcomment. The green line is the inversion of global trade (right-hand scale). The blue line is a trade-weighted average global tariff rate. What the chart shows is that since 1990, the decline in the average tariff coincided with an increase in trade (remember green line is inverted).
Read More »
Read More »
Trump Is Set To Label China A “Currency Manipulator”: What Happens Then?
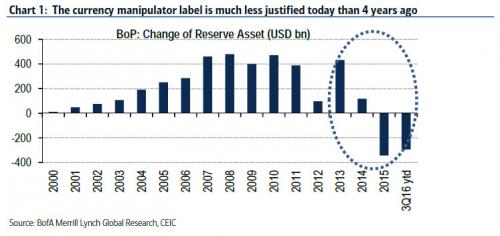
While China has been banging the nationalist drums in its government-owned tabloids, warning daily of the adverse consequences to the US from either a trade war, or from Trump's violating the "One China" policy, a more tangible concern for deteriorating relations between China and the US is that Trump could, and most likely will, brand China a currency manipulator shortly after taking over the the Oval Office.
Read More »
Read More »
Swiss and Eurozone Trade Anomalies
Marc Chandler emphasises the discrepancies between overvalued franc and - despite being overvalued - the massive Swiss trade surplus. Will it continue like that?
Read More »
Read More »


