Tag Archive: S&P 500 Large Cap Index
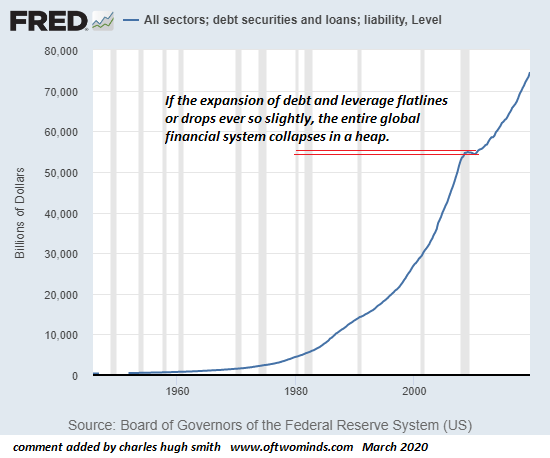
The Covid-19 Dominoes Fall: The World Is Insolvent
Subtract their immense debts and they have negative net worth, and therefore the market value of their stock is zero. To understand why the financial dominoes toppled by the Covid-19 pandemic lead to global insolvency, let's start with a household example. The point of this exercise is to distinguish between the market value of assets and net worth, which is what's left after debts are subtracted from the market value of assets.
Read More »
Read More »
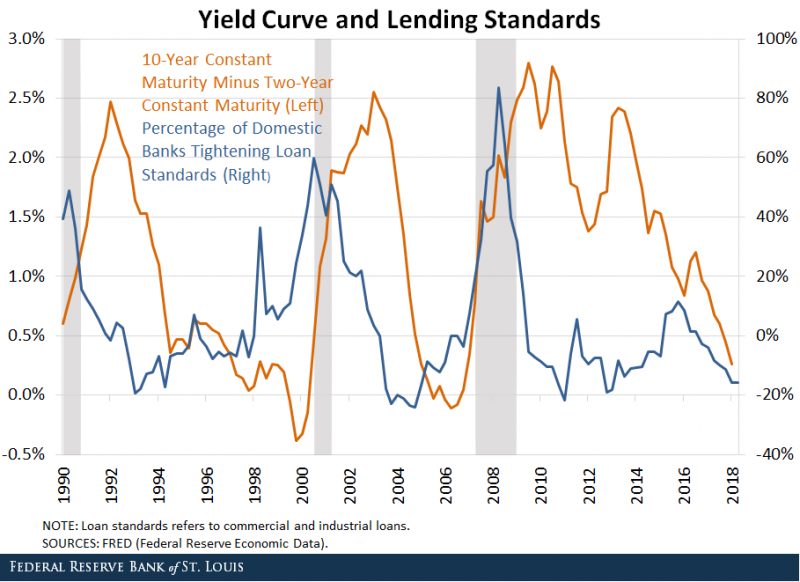
The Fed Has Created a Monster Bubble It Can No Longer Control
The Fed must now accept responsibility for what happens in the end-game of the Moral-Hazard Monster Bubble it created. Contrary to popular opinion, the Federal Reserve didn't set out to create a Monster Bubble that has escaped its control.
Read More »
Read More »
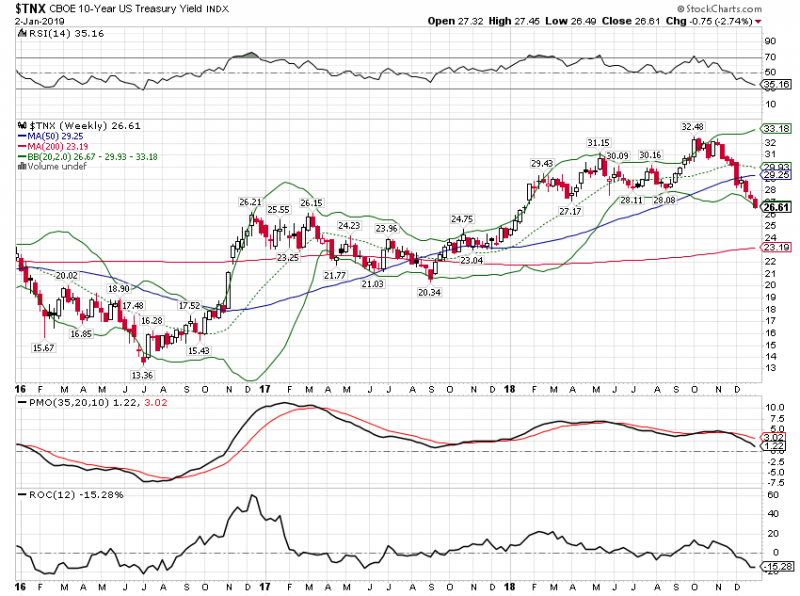
Monthly Macro Monitor: Well Worried
Don’t waste your time worrying about things that are well worried. Well worried. One of the best turns of phrase I’ve ever heard in this business that has more than its fair share of adages and idioms. It is also one of the first – and best – lessons I learned from my original mentor in this business. The things you see in the headlines, the things everyone is already worried about, aren’t usually worth fretting over.
Read More »
Read More »
Living In The Present
It’s that time of year again, time to cast the runes, consult the iChing, shake the Magic Eight Ball and read the tea leaves. What will happen in 2019? Will it be as bad as 2018 when positive returns were hard to come by, as rare as affordable health care or Miami Dolphin playoff games? Will China’s economy succumb to the pressure of US tariffs and make a deal?
Read More »
Read More »
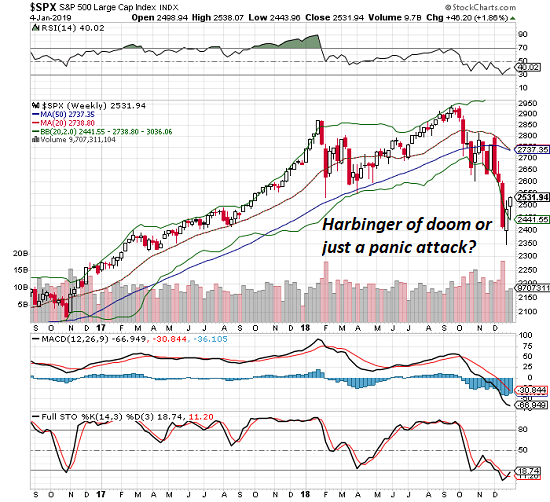
Could Stocks Rally Even as Parts of the Economy Are Recessionary?
It's not yet clear that the stock market swoon is predictive or merely a panic attack triggered by a loss of meds. We contrarians can't help it: when the herd is bullish, we start looking for a reversal. When the herd turns bearish, we also start looking for a reversal.
Read More »
Read More »
The Bear Market Hook
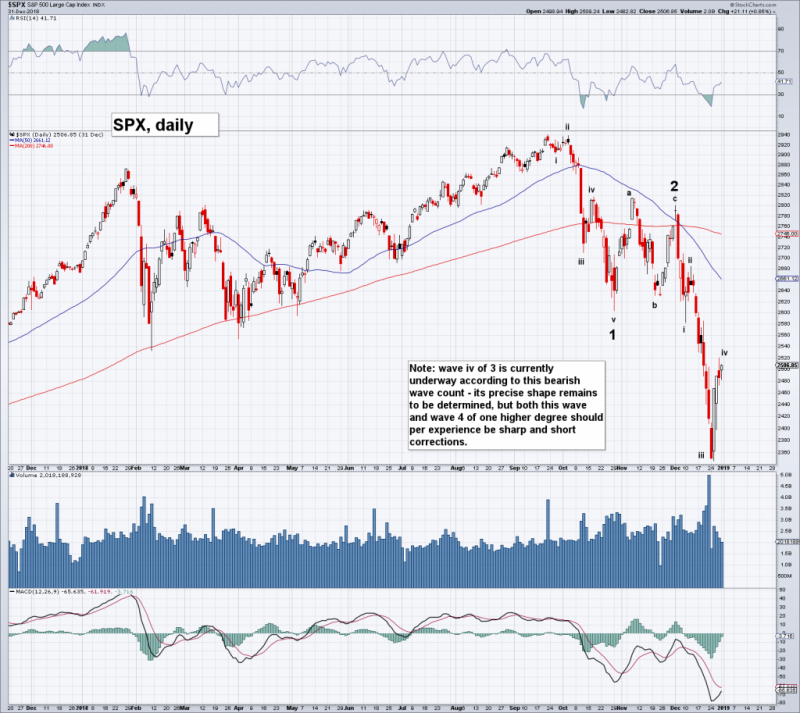
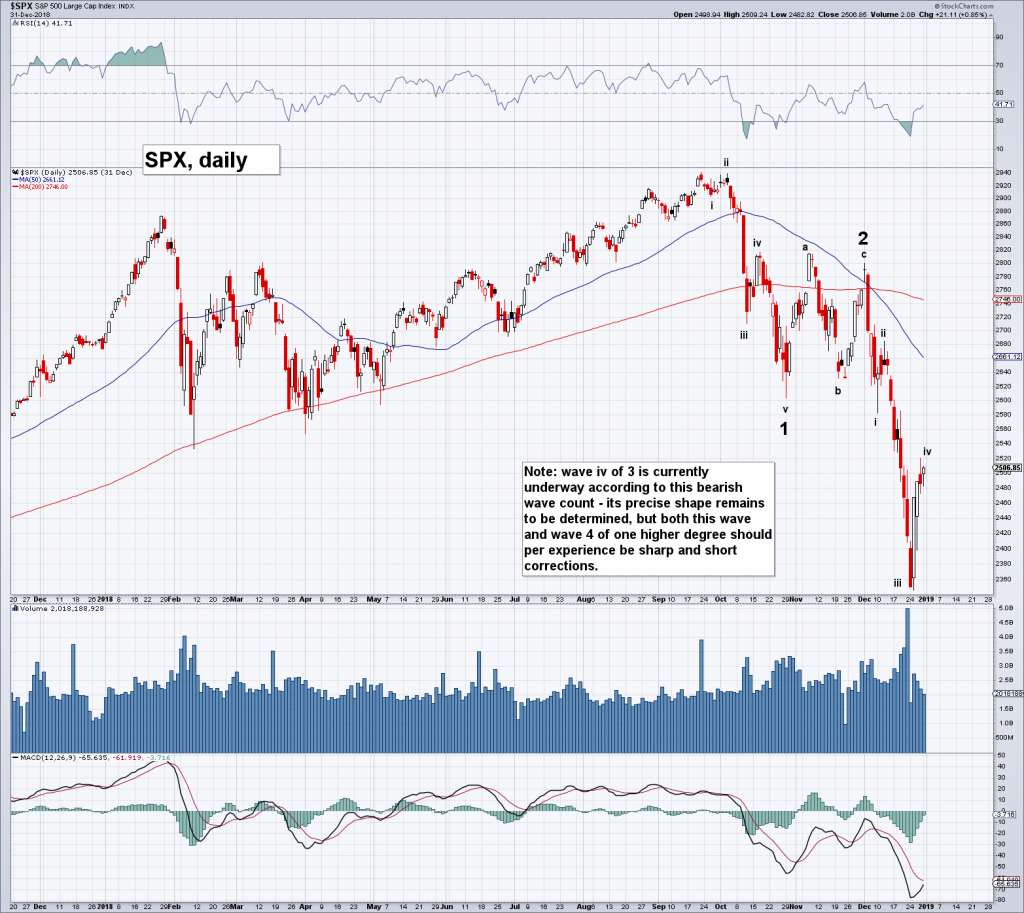
Has a Bear Market in Stocks Begun? The stock market correction into late December was of approximately the same size as the mid 2015/early 2016 twin downturns, so this is not an idle question. Moreover, many bears seem quite confident lately from an anecdotal perspective, which may invite a continuation of the recent upward correction.
Read More »
Read More »
How Dangerous is the Month of October?
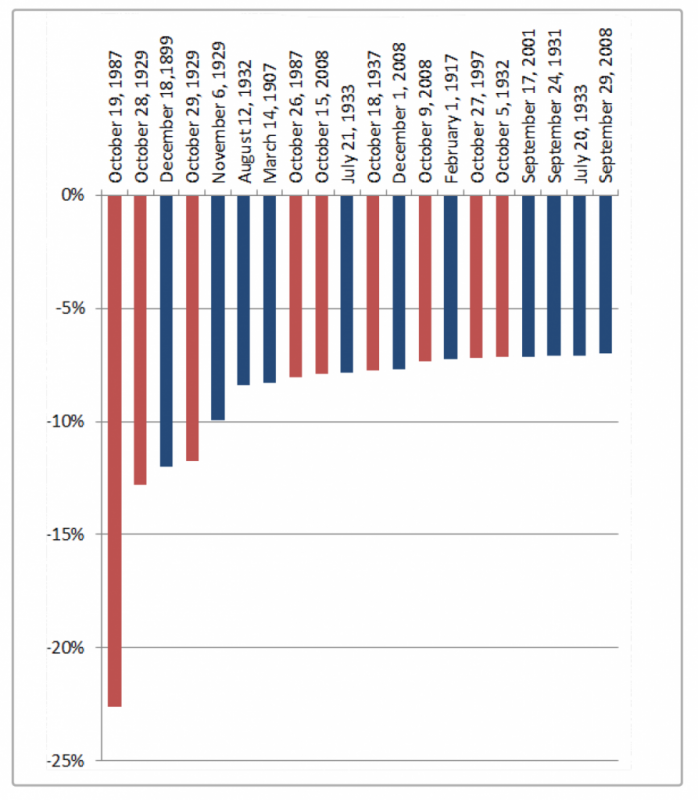
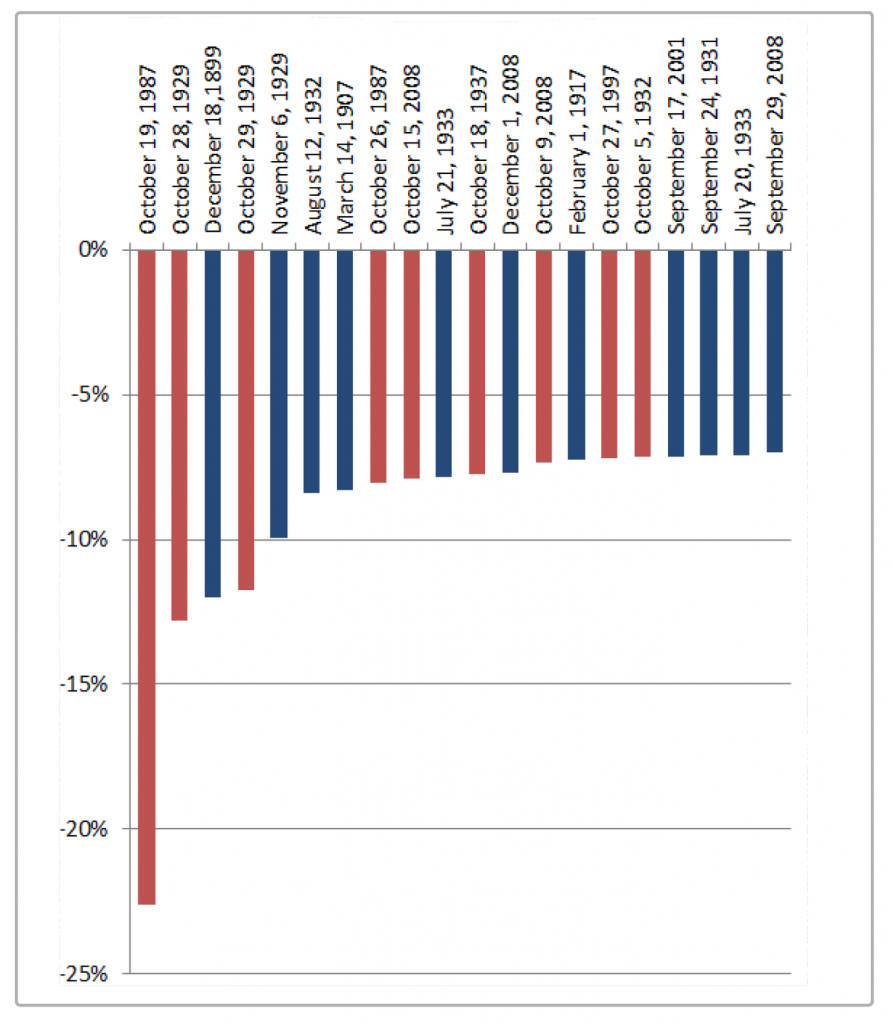
A Month with a Bad Reputation. A certain degree of nervousness tends to suffuse global financial markets when the month of October approaches. The memories of sharp slumps that happened in this month in the past – often wiping out the profits of an entire year in a single day – are apt to induce fear. However, if one disregards outliers such as 1987 or 2008, October generally delivers an acceptable performance.
Read More »
Read More »
Global Asset Allocation Update – September 2018
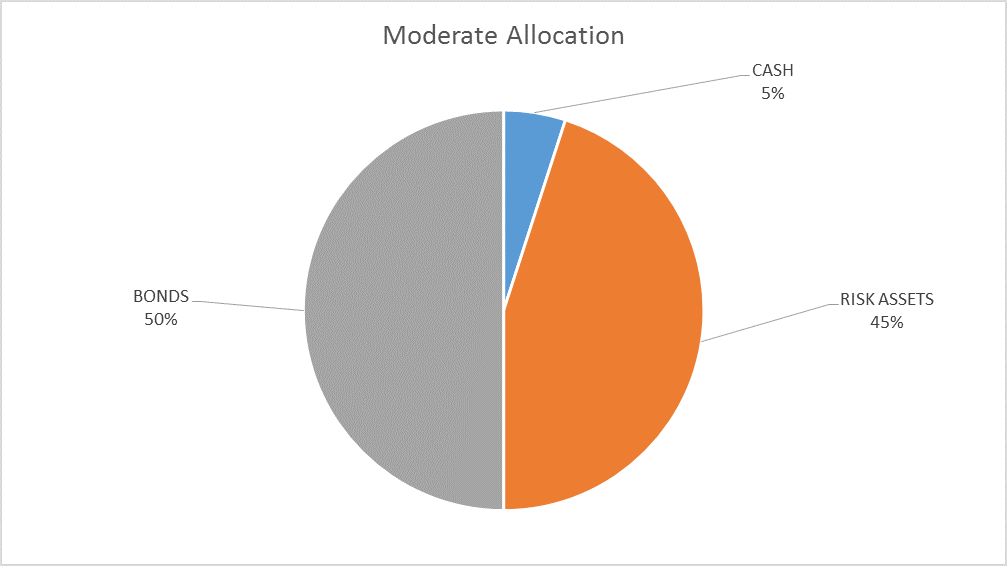
The risk budget is unchanged again this month. For the moderate risk investor, the allocation between bonds and risk assets is 50/50. Decoupling anyone? That’s what the market is whispering right now, that the recent troubles in foreign economies is contained and won’t affect the US. The most obvious example of that trend is the performance of US stocks versus the rest of the world.
Read More »
Read More »
The Global Financial System Is Unraveling, And No, the U.S. Is Not immune
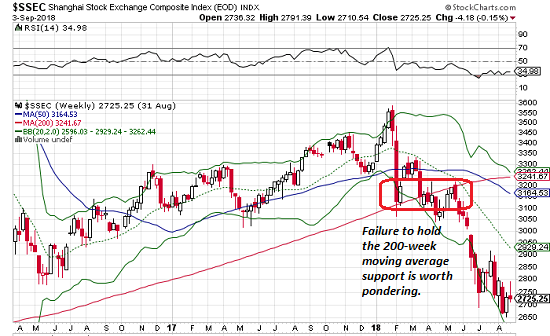
Currencies don't melt down randomly. This is only the first stage of a complete re-ordering of the global financial system. Take a look at the Shanghai Stock Market (China) and tell me what you see: A complete meltdown, right? More specifically, a four-month battle to cling to the key technical support of the 200-week moving average (the red line). Once the support finally broke, the index crashed.
Read More »
Read More »
Global Asset Allocation Update
The risk budget is unchanged again this month. For the moderate risk investor, the allocation between bonds and risk assets is evenly split. The only change to the portfolio is the one I wrote about last week, an exchange of TIP for SHY.
Read More »
Read More »
Global Asset Allocation Update
The risk budget is unchanged this month. For the moderate risk investor the allocation to bonds and risk assets is evenly split. There are changes this month within the asset classes. How far are we from the end of this cycle? When will the next recession arrive and more importantly when will stocks and other markets start to anticipate a slowdown?
Read More »
Read More »
Does Anyone Else See a Giant Bear Flag in the S&P 500?
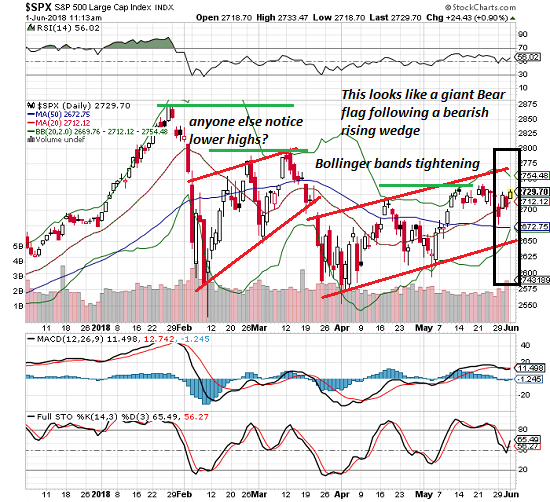
We all know the game is rigged, but strange things occasionally upset the "easy money bet." "Reality" is in the eye of the beholder, especially when it comes to technical analysis and economic tea leaves.
Read More »
Read More »
Global Asset Allocation Update
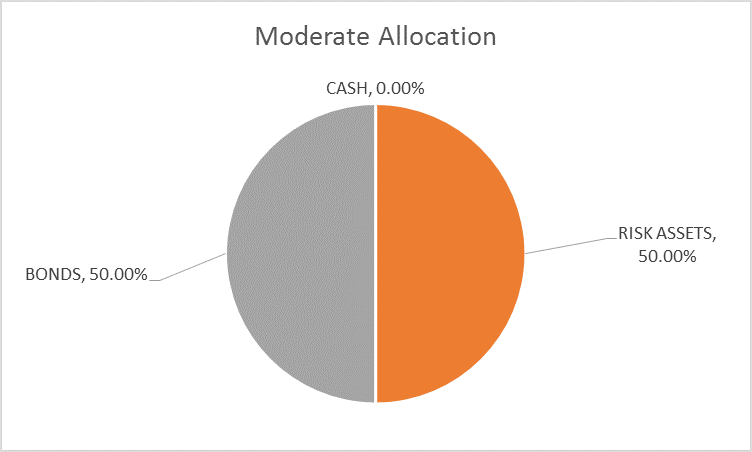
The risk budget changes this month as I add back the 5% cash raised in late October. For the moderate risk investor, the allocation to bonds is still 50% while the risk side now rises to 50% as well. I raised the cash back in late October due to the extreme overbought nature of the stock market and frankly it was a mistake. Stocks went from overbought to more overbought and I missed the rally to all time highs in January.
Read More »
Read More »
A Funny Thing Happened on the Way to Market Complacency / Euphoria
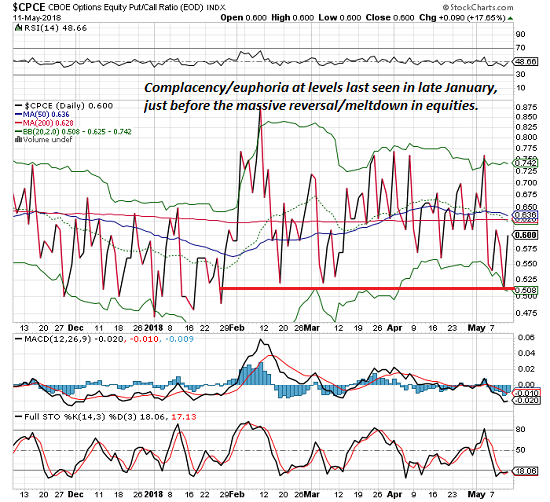
Fortunately for Bulls, none of this matters. A relatively reliable measure of complacency/euphoria in the stock market just hit levels last seen in late January, just before stocks reversed in a massive meltdown, surprising all the complacent/euphoric Bulls. The measure is the put-call ratio in equities. Since this time is different, and the market is guaranteed to roar to new all-time highs, we can ignore this (of course).
Read More »
Read More »
Trendline Broken: Similarities to 1929, 1987 and the Nikkei in 1990 Continue
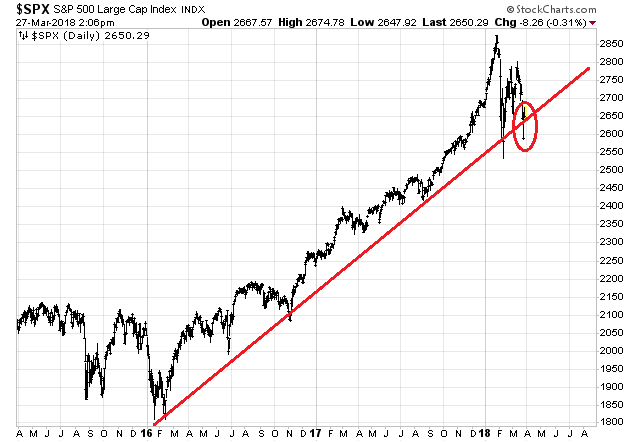
In an article published in these pages in early March, I have discussed the similarities between the current chart pattern in the S&P 500 Index compared to the patterns that formed ahead of the crashes of 1929 and 1987, as well as the crash-like plunge in the Nikkei 225 Index in 1990. The following five similarities were decisive features of these crash patterns.
Read More »
Read More »
US Stock Market – How Bad Can It Get?
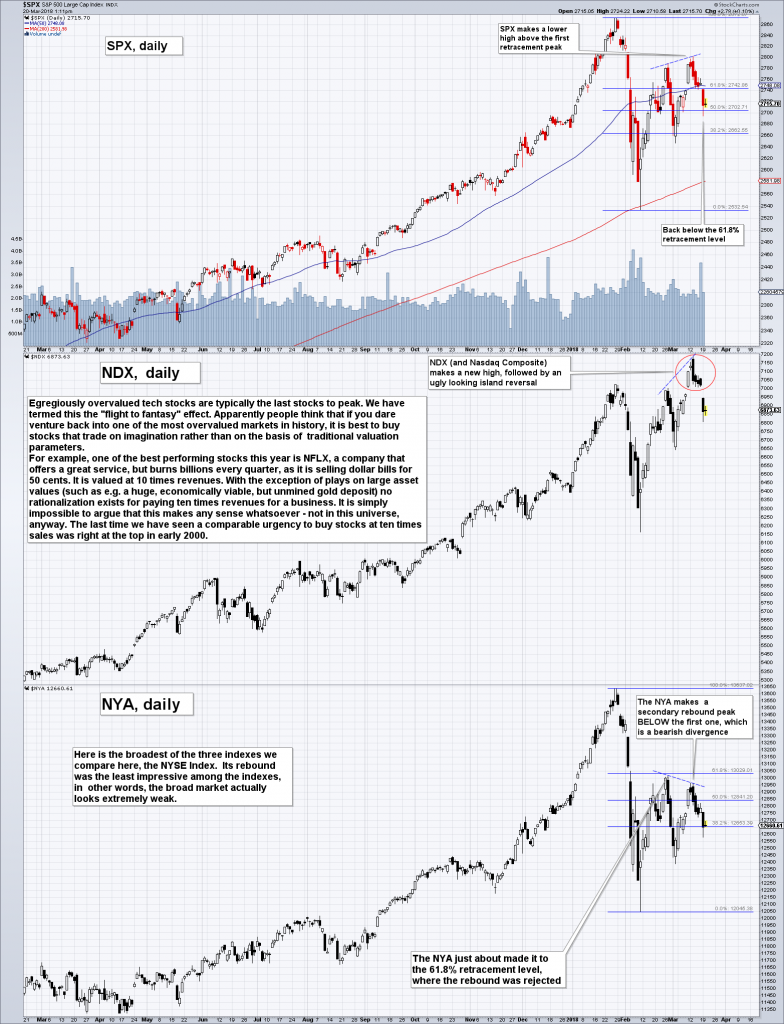
In view of the fact that the stock market action has gotten a bit out of hand again this week, we are providing a brief update of charts we have discussed in these pages over the past few weeks (see e.g. “The Flight to Fantasy”). We are doing this mainly because the probability that a low probability event will actually happen has increased somewhat in recent days.
Read More »
Read More »
US Stock Market – The Flight to Fantasy
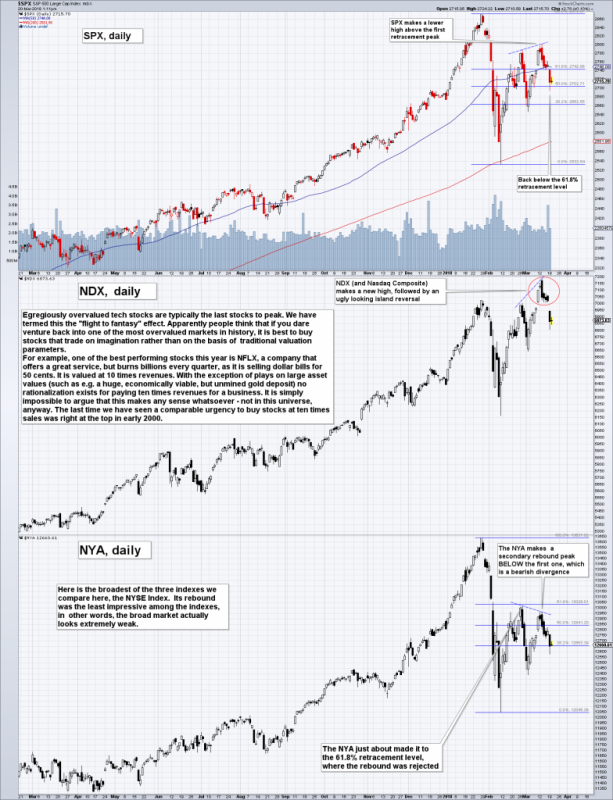
The chart formation built in the course of the early February sell-off and subsequent rebound continues to look ominous, so we are closely watching the proceedings. There are now numerous new divergences in place that clearly represent a major warning signal for the stock market. For example, here is a chart comparing the SPX to the NDX (Nasdaq 100 Index) and the broad-based NYA (NYSE Composite Index).
Read More »
Read More »
Global Asset Allocation Update: Tariffs Don’t Warrant A Change…Yet
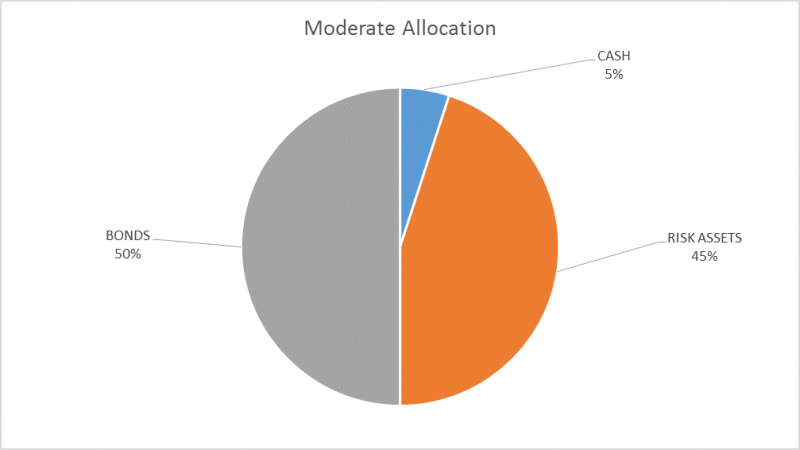
There is no change to the risk budget this month. For the moderate risk investor the allocation to bonds is 50%, risk assets 45% and cash 5%. We have had continued volatility since the last update but the market action so far is pretty mundane. The initial selloff halted at the 200 day moving average and the rebound carried to just over the 50 day moving average.
Read More »
Read More »


