|
Fortunately for Bulls, none of this matters.
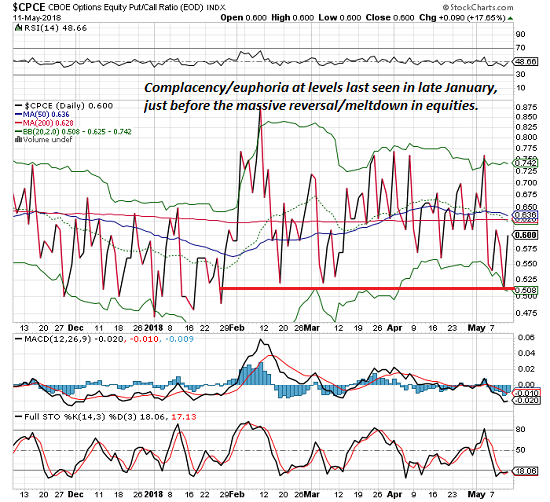
A relatively reliable measure of complacency/euphoria in the stock market just hit levels last seen in late January, just before stocks reversed in a massive meltdown, surprising all the complacent/euphoric Bulls.
The measure is the put-call ratio in equities. Since this time is different, and the market is guaranteed to roar to new all-time highs, we can ignore this (of course).
|
CBOE Options Equity Put/Call Ratio, Dec 2017 - May 2018 |
|
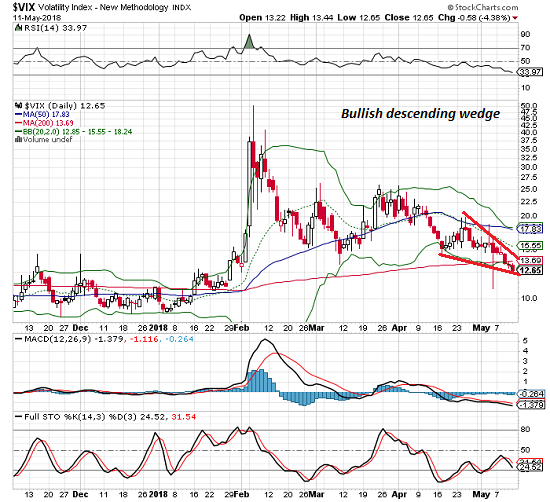
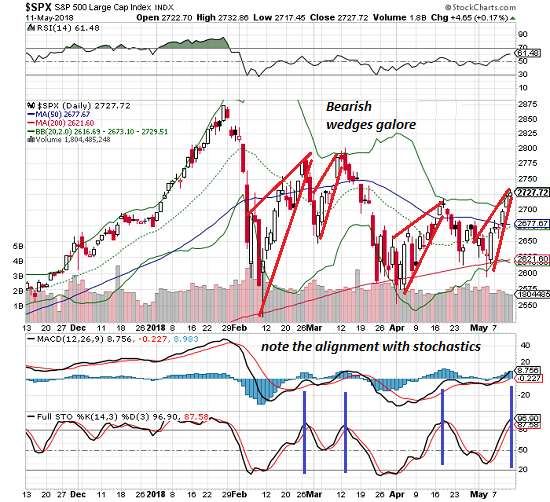
Two of the more reliable technical patterns are falling/rising wedges, also known as descending/ascending wedges or triangles. Ascending wedges are bearish, descending wedges are bullish.
The VIX index, one measure of volatility, has been crushed by the recent euphoria/complacency as participants realize that since this time is different, we don’t need no stinkin’ hedges. Unsurprisingly, the VIX has traced out a falling wedge:
|
Volatility Index, Dec 2017 - May 2018 |
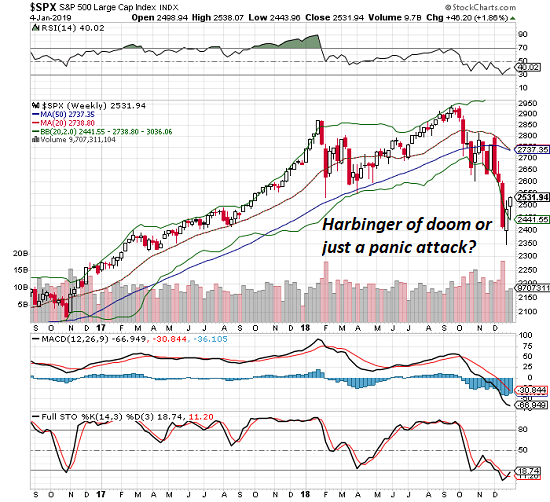
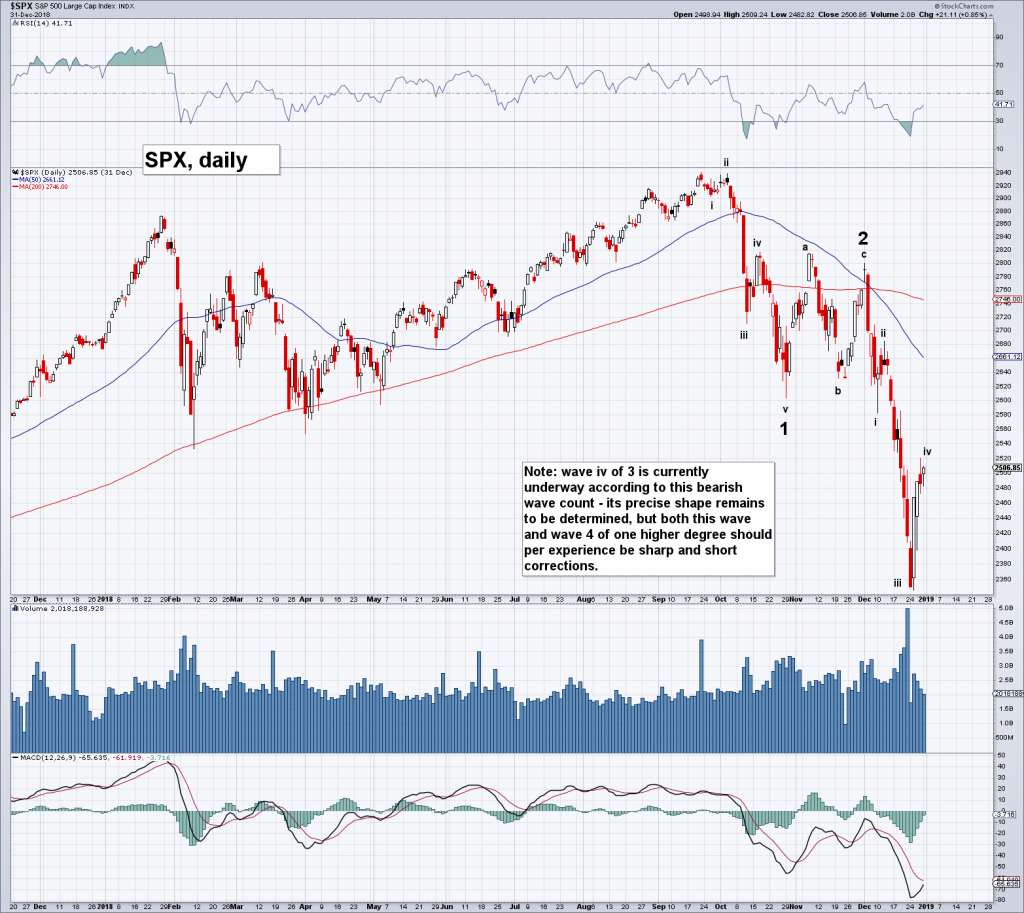
| But a funny thing happened on the way to market complacency/euphoria this year: every “this time is different” manic rally in the S&P 500 (SPX) formed a bearish rising wedge which promptly reversed once the pattern peaked. |
S&P 500 Large Cap Index, Dec 2017 - May 2018(see more posts on S&P 500 Large Cap Index, ) |
Even more compelling (if that’s even possible), the quatloo-bat guano ratio just flashed a huge buy signal, something that only happens on 1.3% of trading days since 1968, so let me repeat: BUY BUY BUY (repeat your Bullish aphorism of choice).
Tags: newslettersent,S&P 500 Large Cap Index


