Tag Archive: Credit Markets
What’s In Your Loan?
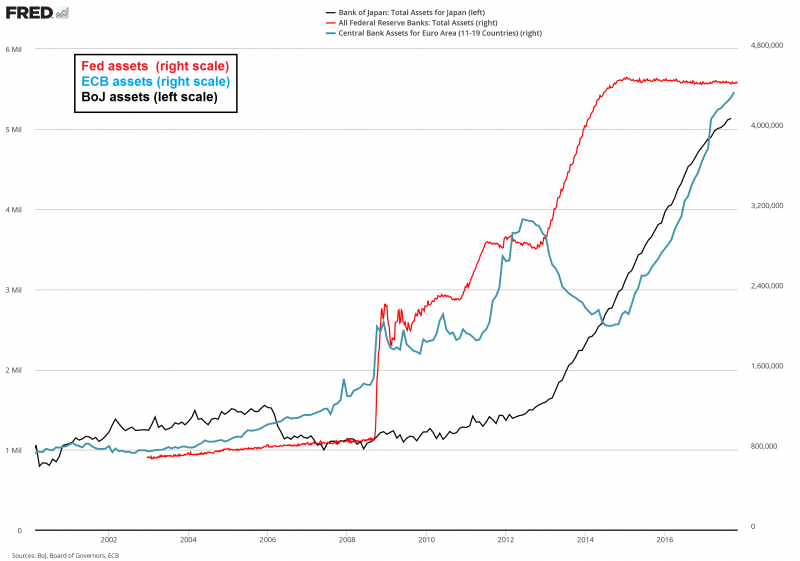
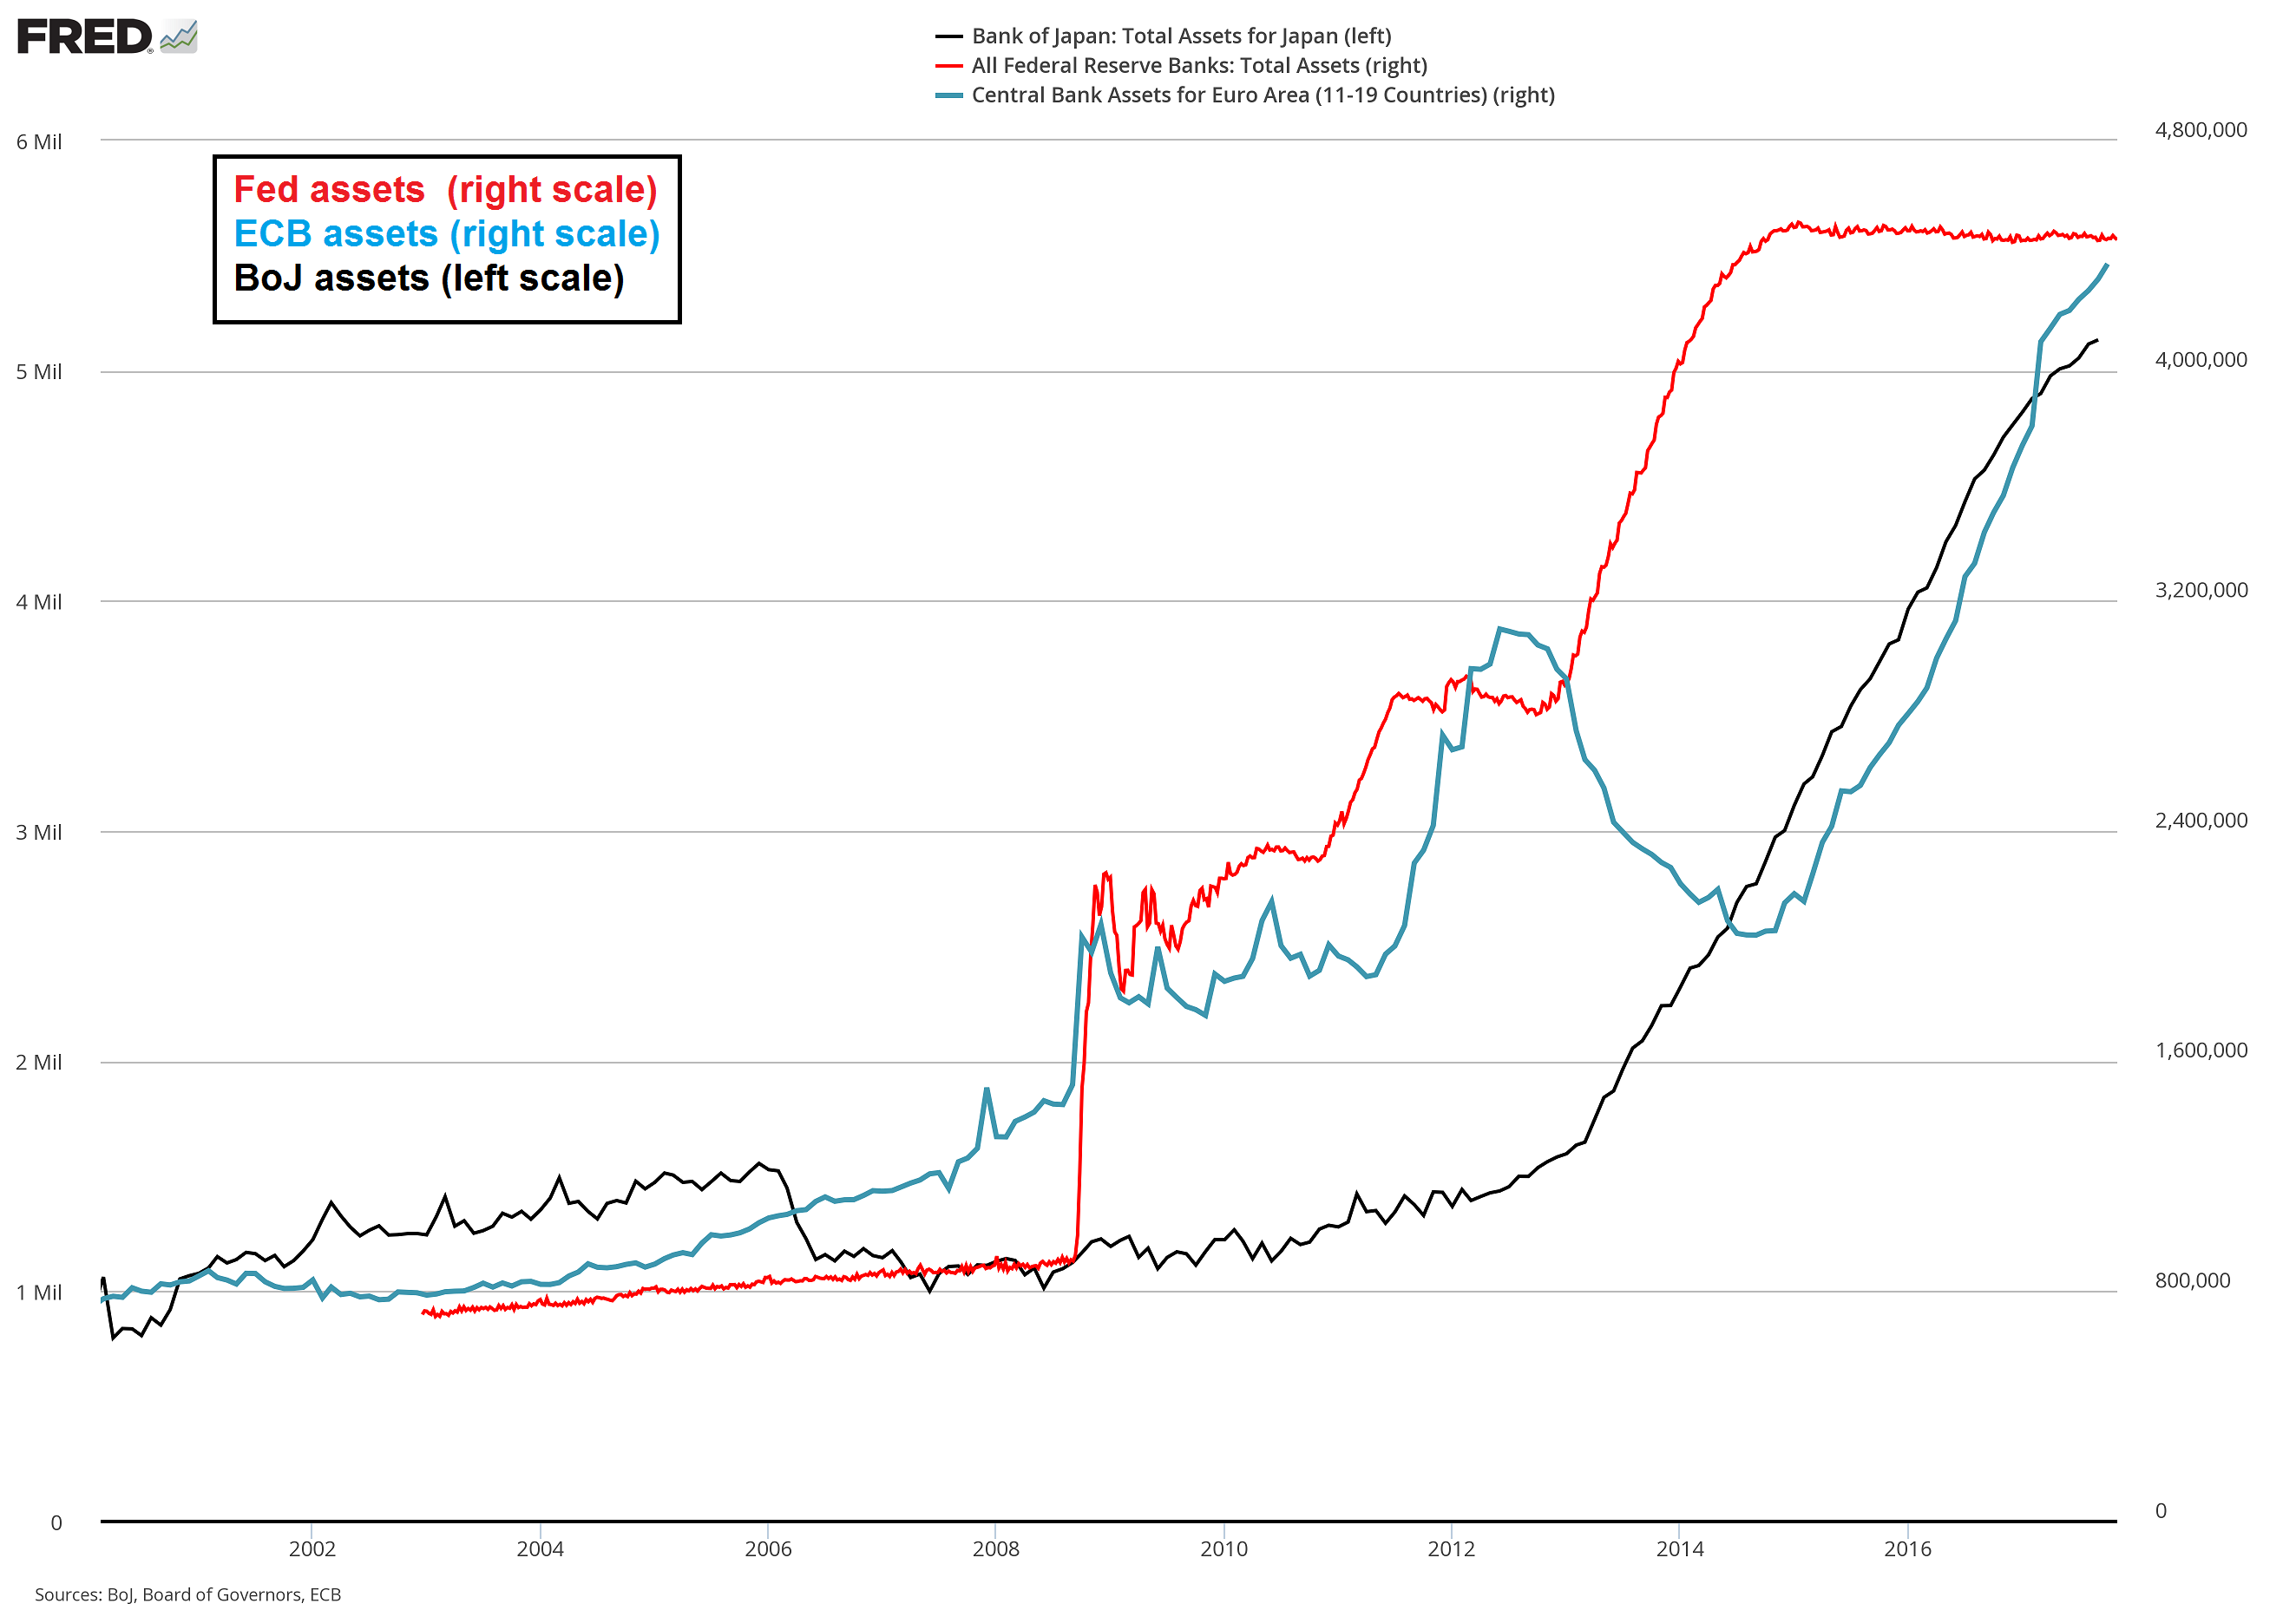
Opposing Monetary Directions
“Real estate is the future of the monetary system,” declares a real estate bug.
Does this make any sense? We would ask him this.
“OK how will houses be borrowed and lent?”
“Look at this housing bond,” he says, pointing to a bond denominated in dollars, with principal and interest paid in dollars.
“What do you mean ‘housing’ bond’,” we ask, “it’s a bond denominated in dollars!”
“Yes, but housing is the collateral.”...
Read More »
Read More »
Repo Quake – A Primer
Chaos in Overnight Funding Markets. Most of our readers are probably aware that there were recently quite large spikes in repo rates. The events were inter alia chronicled at Zerohedge here and here. The issue is fairly complex, as there are many different drivers at play, but we will try to provide a brief explanation.
Read More »
Read More »
Are Credit Spreads Still a Leading Indicator for the Stock Market?
Seemingly out of the blue, equities suffered a few bad hair days recently. As regular readers know, we have long argued that one should expect corrections in the form of mini-crashes to strike with very little advance warning, due to issues related to market structure and the unique post “QE” environment.
Read More »
Read More »
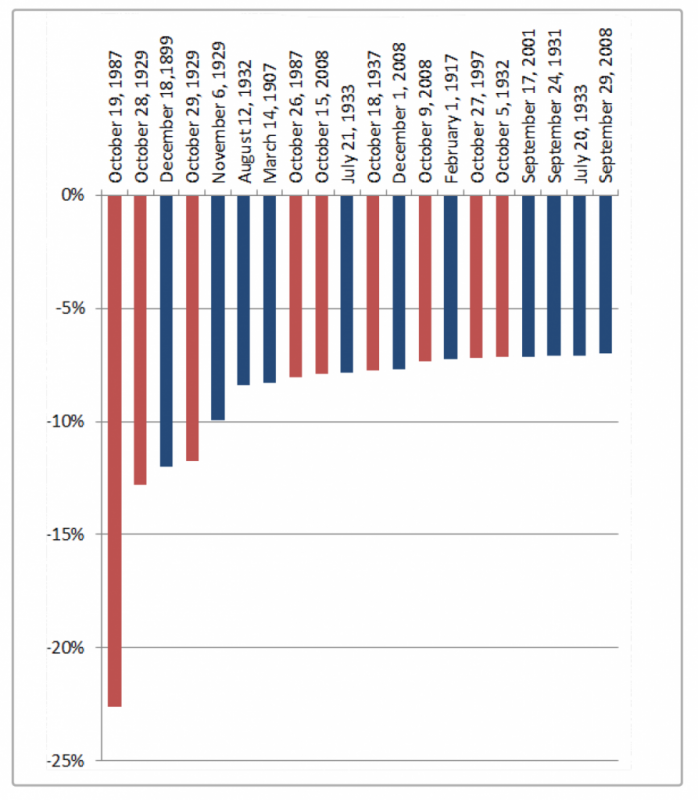
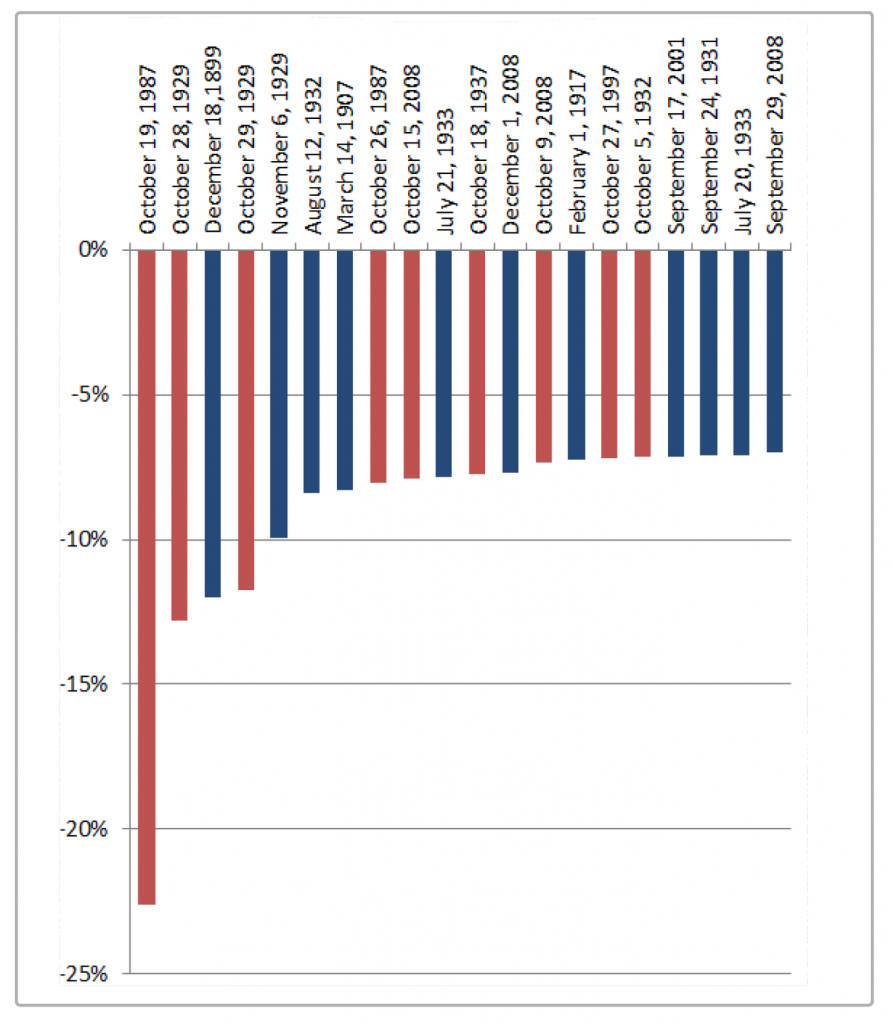
How Dangerous is the Month of October?
A Month with a Bad Reputation. A certain degree of nervousness tends to suffuse global financial markets when the month of October approaches. The memories of sharp slumps that happened in this month in the past – often wiping out the profits of an entire year in a single day – are apt to induce fear. However, if one disregards outliers such as 1987 or 2008, October generally delivers an acceptable performance.
Read More »
Read More »
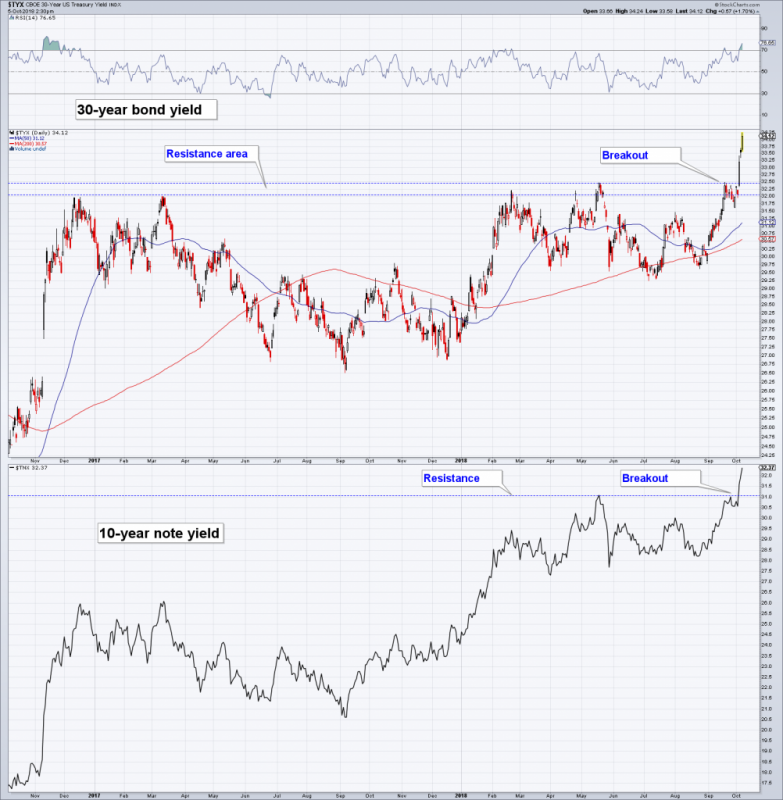
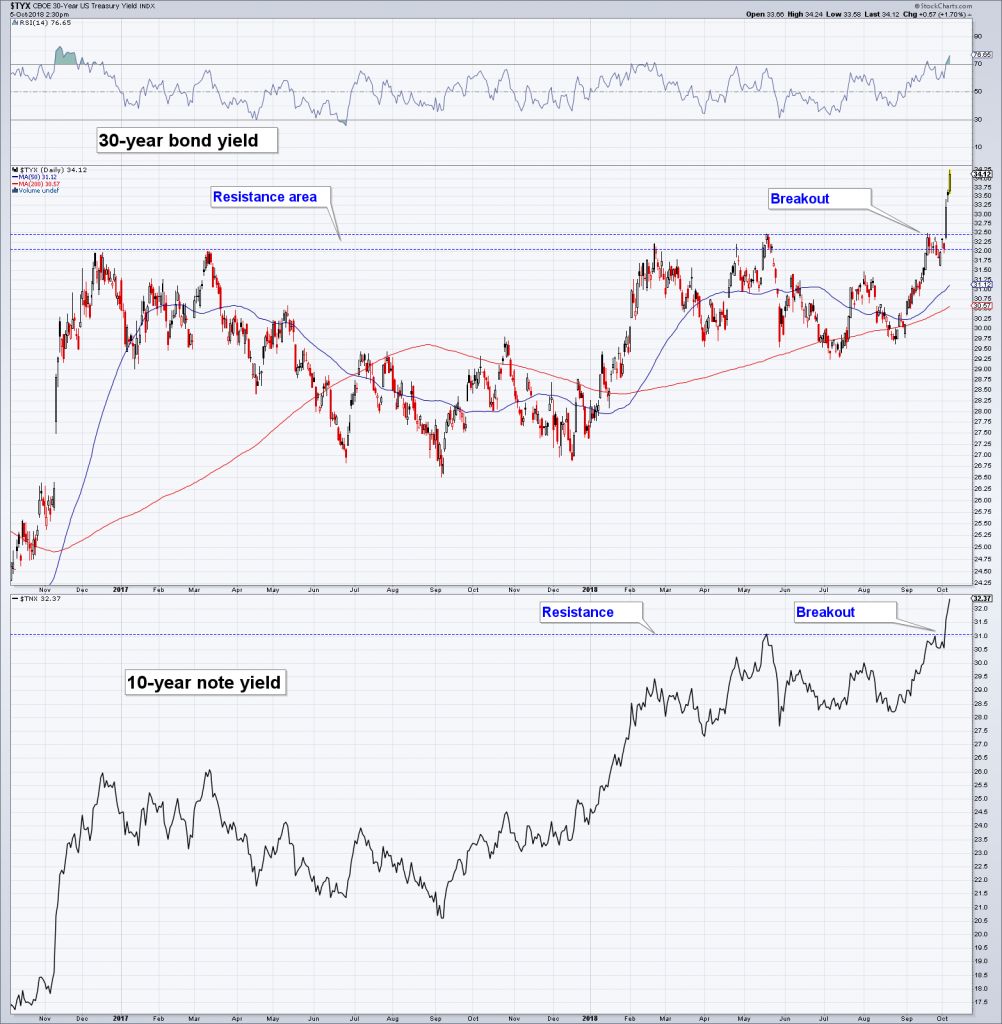
US Stocks and Bonds Get Clocked in Tandem
At the time of writing, the stock market is recovering from a fairly steep (by recent standards) intraday sell-off. We have no idea where it will close, but we would argue that even a recovery into the close won’t alter the status of today’s action – it is a typical warning shot. Here is what makes the sell-off unique:
Read More »
Read More »
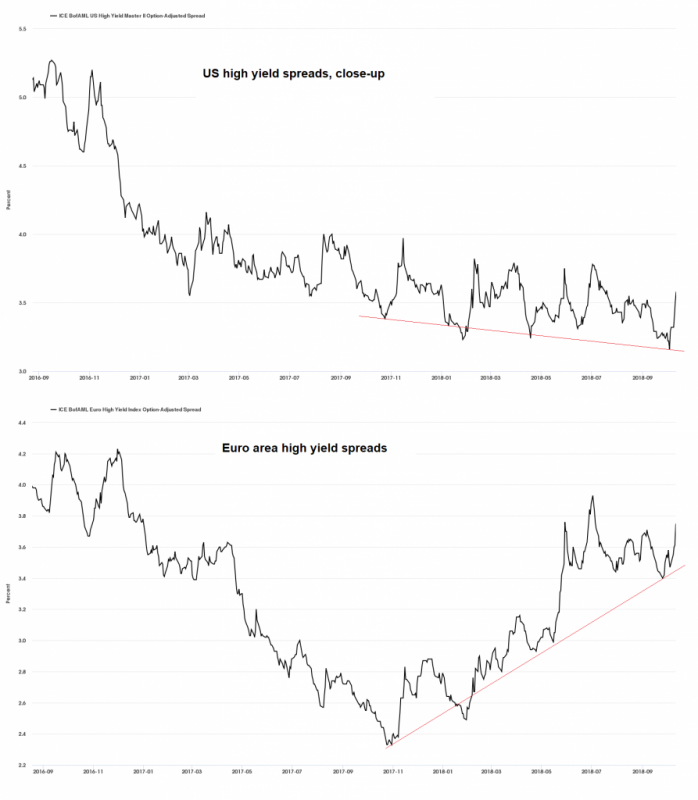
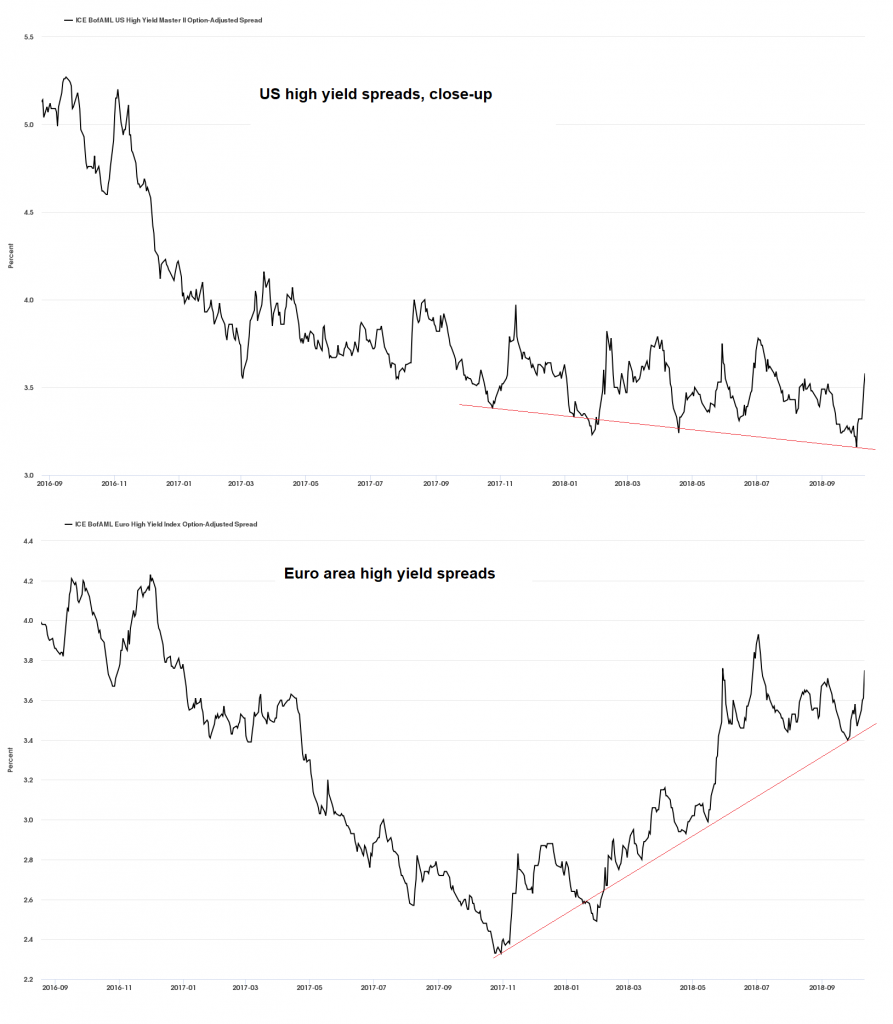
Credit Spreads: Polly is Twitching Again – in Europe
The famous dead parrot is coming back to life… in an unexpected place. With its QE operations, which included inter alia corporate bonds, the ECB has managed to suppress credit spreads in Europe to truly ludicrous levels.
Read More »
Read More »
Tales from “The Master of Disaster”
Daylight extends a little further into the evening with each passing day. Moods ease. Contentment rises. These are some of the many delights the northern hemisphere has to offer this time of year. As summer approaches, and dispositions loosen, something less amiable is happening. Credit markets are tightening. The yield on the 10-Year Treasury note has exceeded 3.12 percent.
Read More »
Read More »
US Money Supply Growth Jumps in March , Bank Credit Growth Stalls
There was a sizable increase in the year-on-year growth rate of the true US money supply TMS-2 between February and March. Note that you would not notice this when looking at the official broad monetary aggregate M2, because the component of TMS-2 responsible for the jump is not included in M2. Let us begin by looking at a chart of the TMS-2 growth rate and its 12-month moving average.
Read More »
Read More »
Stock and Bond Markets – The Augustine of Hippo Plea
Most fund managers are in an unenviable situation nowadays (particularly if they have a long only mandate). On the one hand, they would love to get an opportunity to buy assets at reasonable prices. On the other hand, should asset prices actually return to levels that could be remotely termed “reasonable”, they would be saddled with staggering losses from their existing exposure. Or more precisely: their investors would be saddled with staggering...
Read More »
Read More »
US Equities – Mixed Signals Battling it Out
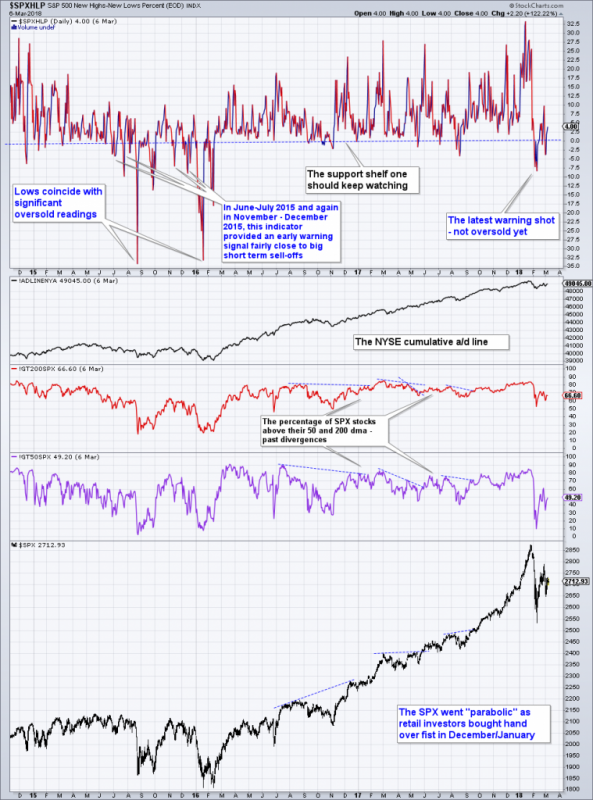
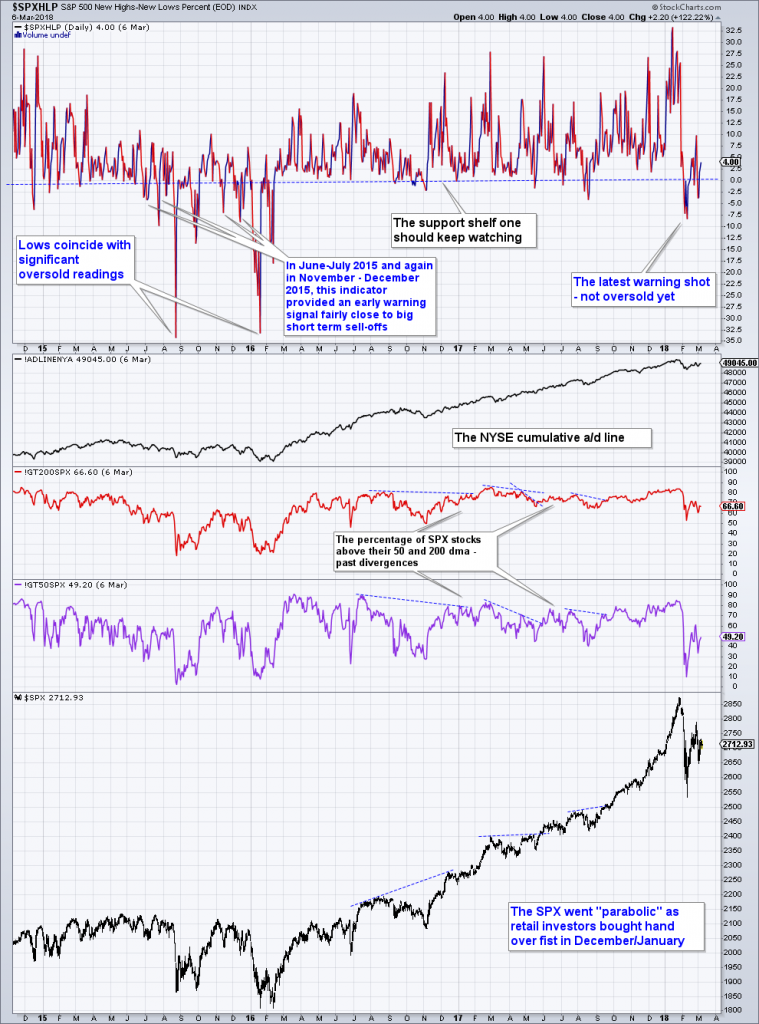
Readers may recall that we looked at various market internals after the sudden sell-offs in August 2015 and January 2016 in order to find out if any of them had provided clear advance warning. One that did so was the SPX new highs/new lows percent index (HLP). Below is the latest update of this indicator.
Read More »
Read More »
How the Asset Bubble Could End – Part 2
There is just one more positioning indicator we want to mention: after surging by around $126 billion since March of 2016, NYSE margin debt has reached a new all time high of more than $561 billion. The important point about this is that margin debt normally peaks well before the market does. Based on this indicator, one should not expect major upheaval anytime soon. There are exceptions to the rule though – see the caption below the chart.
Read More »
Read More »
How the Asset Bubble Could End – Part 1
We recently pondered the markets while trying out our brand-new electric soup-cooling spoon (see below). We are pondering the markets quite often lately, because we believe tail risk has grown by leaps and bounds and we may be quite close to an important juncture, i.e., the kind of pivot that can generate both a lot of excitement and a lot of regret all around.
Read More »
Read More »
Credit Spreads: The Coming Resurrection of Polly
Suspicion isn’t Merely Asleep – It is in a Coma (or Dead). There is an old Monty Python skit about a parrot whose lack of movement and refusal to respond to prodding leads to an intense debate over what state it is in. Is it just sleeping, as the proprietor of the shop that sold it insists? A very tired parrot taking a really deep rest?
Read More »
Read More »
LIBOR Pains
If one searches for news on LIBOR (=London Interbank Offered Rate, i.e., the rate at which banks lend dollars to each other in the euro-dollar market), they are currently dominated by Deutsche Bank getting slapped with a total fine of $775 million for the part it played in manipulating the benchmark rate in collusion with other banks (fine for one count of wire fraud: US$150 m.; additional shakedown by US Justice Department: US$625 m., the price...
Read More »
Read More »
Follow the Money
PARIS – It’s back to Europe. Back to school. Back to work. Let’s begin by bringing new readers into the discussion… and by reminding old readers (and ourselves) where we stand. US economic growth: average annual GDP growth over time spans ranging from 120 to 10 years (left hand side) and the 20 year moving average of annual GDP growth since 1967
Read More »
Read More »
Insanity, Oddities and Dark Clouds in Credit-Land
Insanity Rules Bond markets are certainly displaying a lot of enthusiasm at the moment – and it doesn’t matter which bonds one looks at, as the famous “hunt for yield” continues to obliterate interest returns across the board like a steamroller.
Read More »
Read More »
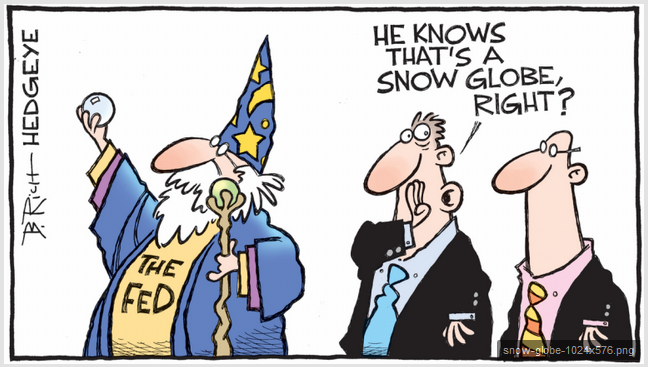
The Fed Doomsday Device
Debt is just the flip side of credit. As debt goes bad, credit disappears. And then the system that created so much credit-money will go into reverse, destroying the nation’s money supply.
The money supply (actually, the supply of ready credit) will shrink – suddenly and dramatically. And what should have been a minor, routine pullback in the economy will become a catastrophic panic.
Read More »
Read More »
Down Go the Hopes and Dreams of Three Generations
On Wednesday, Janet Yellen pressed on the broken buttons again. After the two day FOMC meeting, the Fed Chair announced they’d continue pressing the federal funds rate down to just a ¼ to ½ percent – effectively zero. What type of insanity is this?
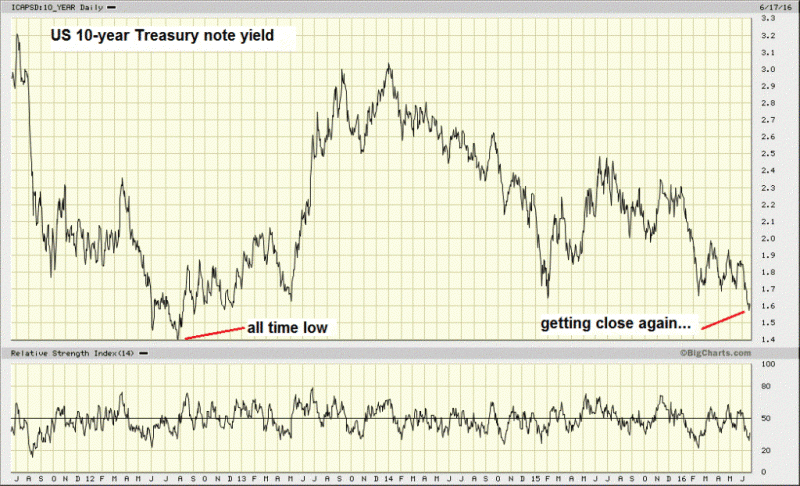
If she keeps it up, and whole thing doesn’t implode, the yield on the 10-Year Treasury note could also slip below zero…along with the hopes and dreams of three generations of retirees.
Read More »
Read More »


