Pater Tenebrarum
My articles My siteAbout meMy videosMy books
Follow on:TwitterSeeking AlphaFacebook
Wrong FocusIf one searches for news on LIBOR (=London Interbank Offered Rate, i.e., the rate at which banks lend dollars to each other in the euro-dollar market), they are currently dominated by Deutsche Bank getting slapped with a total fine of $775 million for the part it played in manipulating the benchmark rate in collusion with other banks (fine for one count of wire fraud: US$150 m.; additional shakedown by US Justice Department: US$625 m., the price tag for a deferred prosecution agreement). |
 . |
| Bad, but not deadly for the wobbling banking giant. There is a far more important fact to focus on though – namely what LIBOR has actually done lately. Let us take a look: |
London Interbank Offered Rate - 3 Months, April 2016 - 2017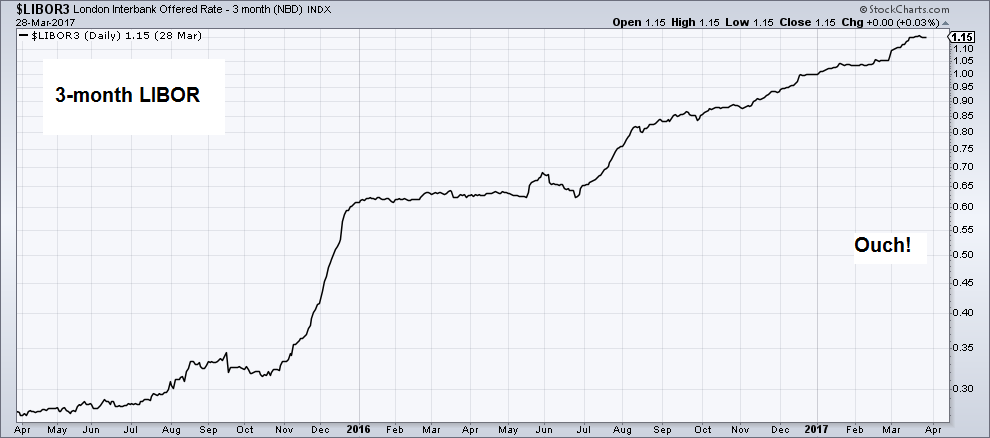 Since mid 2015, 3 month LIBOR has soared from a low of approx 22.5 basis points to its current level of 115 basis points – i.e., it is now more than 5 times higher than two years ago. The “ouch” is explained further below. - Click to enlarge |
| The initial surge in LIBOR was due to a combination of the Fed finally hiking rates and new rules for US money market funds taking shape, which were rightly expected to starve European banks of a major source of dollar funding. The latter continued to affect the market throughout 2016, as US MM funds indeed shifted funds from CP issued by European banks to t-bills (this has incidentally also played a major role in boosting domestic US money supply last year).
Along with the surge in LIBOR we have seen a widening in the TED spread (the spread between 3M LIBOR and the t-bill discount rate). Normally this is a sign of increasing stress in the banking system, but we are not sure if that interpretation is currently applicable. The absolute size of the spread is still a far cry from what was seen during past crisis situations. The spread is also well off its 2016 spike high, which we take as an indication that the disruption caused by the retreat of US MM funds from funding European banks is abating. So what is the problem? It is actually not the banking system that gives cause for immediate concern. One must keep in mind that risks in the financial system have shifted since the 2008 crisis. Eventually, these risks are still going to redound on the banking system, but it is so to speak one step removed from the currently ticking time bomb, rather than being right at its center. |
TED Spread, Sep 2013 - Jan 2017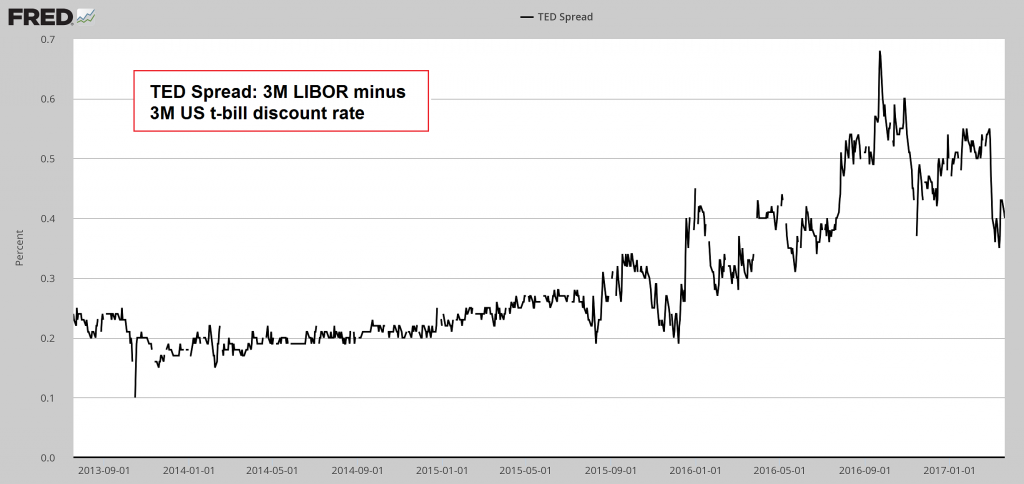 TED spread: still high, but not as high as it was last year - Click to enlarge |
The Nature of the ProblemAs mentioned above, LIBOR is a benchmark reference rate (which explains why some banks were so eager to manipulate it). The pricing of all kinds of floating-rate debt is tied to it (corporate loans, mortgages, student loans, credit card debt, and assorted derivatives, such as currency and interest rate swaps, etc.). That has now become a problem. Before we get to that, here is some background information: One of the components of the global debtberg that has grown at a particularly breath-taking pace in recent years is corporate debt. As we have often mentioned in these pages, we regard it as a major Achilles heel of the Bernanke echo bubble. It already looked dubious before the recent rise in rates (see “A Dangerous Boom in Unsound Corporate Debt”) and has kept growing since then. We often post a chart that adds up outstanding corporate bonds and bank debt, but the chart actually shows less than half of total US corporate liabilities, which currently amount to more than $18 trillion. There are also the “forgotten” $3 trillion in off-balance sheet operating leases, which are currently only known to avid readers of footnotes found in earnings reports, as Bloomberg recently reported. |
Corp Liabilities and Wilshire, 1975 - 2015 Debt of US non-financial corporations: total liabilities (blue line), outstanding bonds + bank debt (red line) and the Wilshire Total Market Index (black line) – the Wilshire Index reflects the bubble in asset prices; these are prone to suffering a “reversal to the mean”. Debt levels will remain where they are when that happens, but the collateral backing a lot of debt will be perceived to be less valuable. There is a multi-layered feedback loop between asset prices and debt that has become quite important for the economy. - Click to enlarge |
| There are several points worth noting in this context: 1. corporate debt relative to assets is back at a record high (last seen at the peak of the late 1990s mania); 2. US corporations are spending far more than they are taking in, i.e., the sum of capex, investment, dividends and stock buybacks vastly exceeds their gross cash flows – the gap is in fact at a record high, above the previous record set in 2007. 3. the return on equity of US corporations is at a record low (yes, you read that right!).
Obviously, the gap between spending and cash flows is funded with debt, which in this context probably deserves to be called Ponzi debt. Not to forget, debt is an absolute figure. The same cannot be said of income or the value of assets, both of which are moving targets. Everything is fine as long as the latter are moving up – alas, it is in their nature to occasionally misbehave. |
US Corporates, Feb 1996 - 2016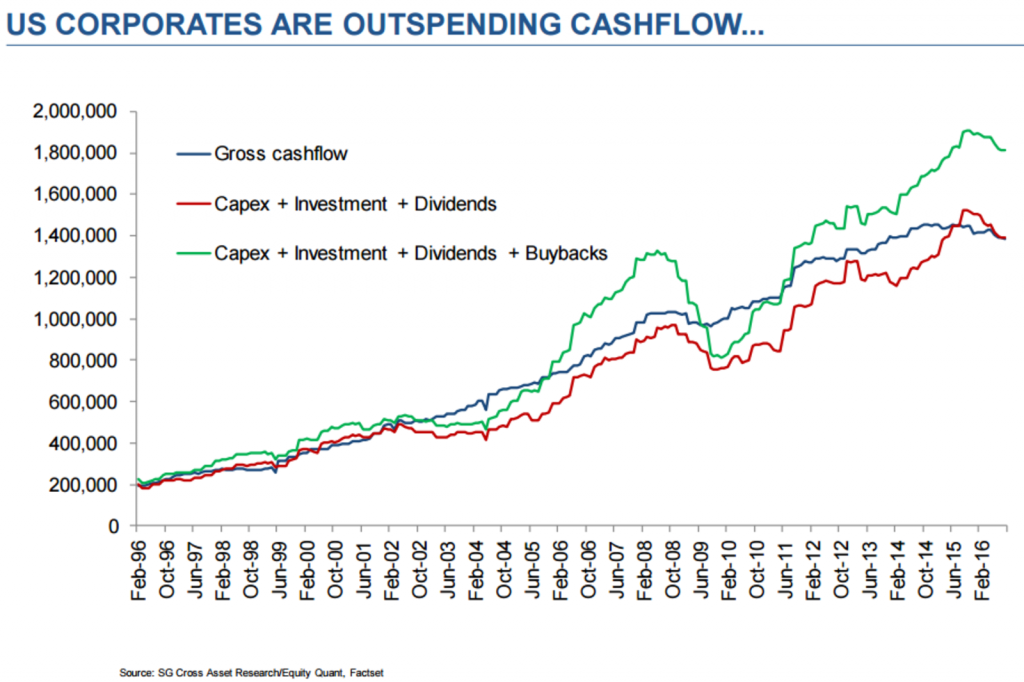 The gap between non-financial corporate spending on capex/ investment/ dividends and stock buybacks vs. gross cash flows is at a new record high. Such expressions of unbridled overconfidence are usually soon punished - Click to enlarge |
| The profitability of US companies is rather underwhelming at the current juncture. It is probably not really the best moment to load up on debt: |
US Nonfinancial Companies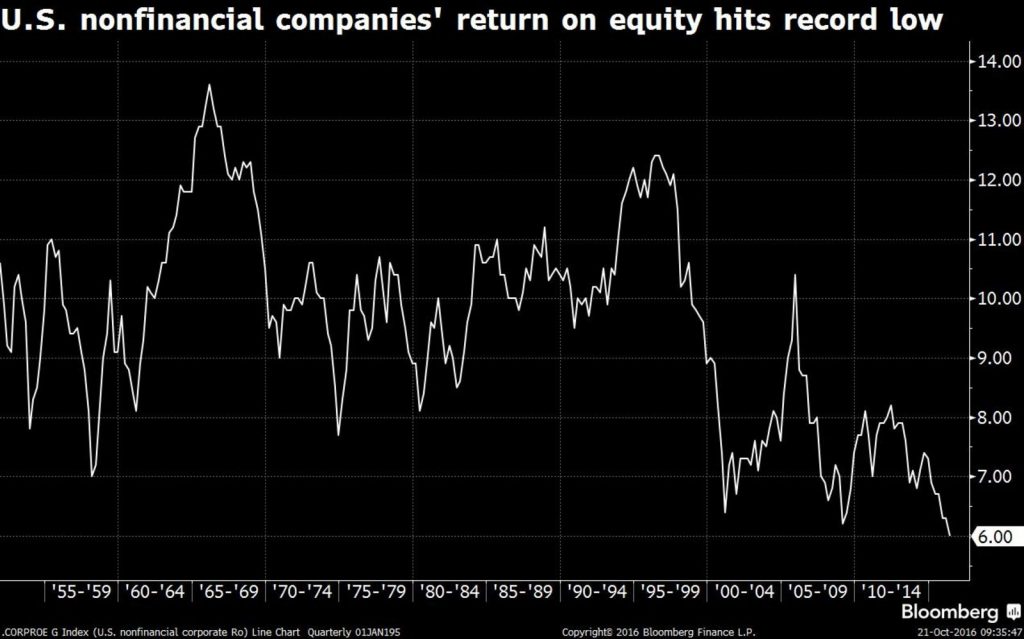 US corporate profitability produces a record as well, but the wrong kind - Click to enlarge |
Coming LIBOR Pains
This brings us back to LIBOR. As mentioned above, the rate is used in pricing a lot of variable rate debt – and as it turns out, the 1% level represents a threshold that is actually rather important for corporate debt. As a recent Barron’s article informs us:
“The rate hasn’t climbed above 1% since prior to the financial crisis. Most corporate loans have so-called Libor floors, so the loans wouldn’t reset higher until the 1% mark had been breached. Now that it has, with each rate hike, companies will owe more on their loans. […] And there are a lot more very leveraged companies now than there were even a few years ago.
(emphasis added)
This is inter alia going to impact the leveraged loan market. In mid March Fitch weighed in on that particular problem:
“Subsequent rate hikes would expose leveraged loan issuers to reset risk that could pressure credit profiles and cash flow generation. This risk is most acute for deeply speculative-grade credits with large amounts of floating rate debt, already large interest burdens, and limited to negative free cash flow.
Near-term interest rate risk is most evident for leveraged issuers who took advantage of longstanding favorable market conditions to issue large amounts of floating-rate debt, but whose credit profiles deteriorated due to secular challenges or idiosyncratic issues that resulted in higher leverage, depressed cash flows and limited liquidity.”
(emphasis added)
We admire the agency’s ability to somehow still sound a hopeful note by stressing that only really bad companies facing “secular challenges” or “idiosyncratic issues” are going to be affected. Everybody else will be immune! Barron’s echoes this sentiment by pointing out that investors in these loans are actually going to enjoy an income bump – with a small, but not unimportant qualifier:
“Of course, investors who own corporate loans (whether in a fund, a business development company (BDC) or a collateralized loan obligation (CLO) can benefit from the higher interest payments — as long as the issuer can afford the rising cost.
(emphasis added)
Investors are actually quite likely to get burned down the road. In order to comply with new regulations, banks have shed a lot of risk-weighted assets, including their proprietary corporate bond trading portfolios. This has shifted a lot of risk to investors, who have loaded up on all sorts of risky debt in the incessant and frankly utterly absurd “hunt for yield” central banks have provoked with their ultra-loose monetary policy.
Of course, banks are lending a bunch of money to investors, which enables them to boost returns via leverage. Banks create CLOs, but are increasingly forced to shed them from their own books on regulatory grounds. Hedge funds have been offered generous incentives to invest in these instruments in order to keep CLO production going at rates the banks have become accustomed to. We mentioned this some time ago in “Embracing Leverage Again” – an excerpt from a WSJ article that appeared at the time provides interesting details:
Banks have offered to lend some investors as much as $9 for every dollar that the buyers invest in CLOs, say traders and strategists. Others are being offered $8 for every $2. An investor in a triple-A-rated CLO earning 1.50 percentage point over the London interbank offered rate—using 10% of his or her own money and paying 0.80 percentage point over Libor for the financing—could earn about 8% in a year.
That compares with annual interest rates near 2% on a standard triple-A CLO. Citigroup researchers in a mid-April note to clients predicted that the new source of financing could help drive up prices of triple-A-rated CLOs.”
(emphasis added)
| The opportunity to make a paltry 8% per year on an investment that is leveraged 10:1 was apparently considered such a great deal that it was expected to trigger sufficient demand for these securities to drive up their prices – in spite of the fact that banks no doubt were and are producing them by the wagon-load. That is certainly testament to the insanity of the echo bubble. However, banks are lately becoming reluctant to boost their own lending to corporations further:
As an aside, since the next crisis is far more likely to be focused on corporate debt rather than mortgage debt, it is irrelevant that CLOs have held up better than CDOs during the GFC. Similarly, triple-A ratings of structured credit products can quickly become meaningless in a credit crisis. CLOs repackage junk and make it fit for top ratings by means of overcollateralization rather than the creation of tranches of different seniority, but ultimately this is exactly the same trap in different clothing. |
Commercial Loan Growth, Jul 2010 - Jan 2017 Corporate & Industrial loans, y/y growth rate. Growth in bank lending to companies has slowed from an interim peak of 13.30% in 2015 to 3.16% currently (“cold feet syndrome”). In the absence of QE, this slowdown in credit growth affects money supply growth, which in turn increases the probability that asset prices will fall - Click to enlarge |
Conclusion – A Bug Waiting for a WindshieldWe don’t expect this first round of debt repricing to necessarily trigger a crisis – we don’t know what the threshold will be. We note though that demand for corporate debt and in particular junk debt has been enormous, and corporations have obviously sated it by producing more debt than ever before (with covenants becoming progressively less stringent). The liquidity of many of these debt instruments is a lot worse than it once was, as banks have vacated their previous role of market makers. Both the companies most at risk (i.e., those mentioned by Fitch) and the most highly leveraged investors operate at the fringes of the system and occasional defaults are normally easily absorbed. Even an entire (and fairly sizable) sector getting into trouble is not necessarily a big deal as long as system-wide free liquidity remains plentiful, as was demonstrated by the energy sector’s woes in 2015. All of the above describes a latent risk, but one that keeps growing – a happy bug in search of a windshield, so to speak. Is is also worth noting that the echo bubble doesn’t have a particular focus – it is diffuse in the sense that it has become a “bubble in everything”. This is inter alia illustrated by the median price-revenue ratio of the stocks in the S&P 500 Index shown by John Hussman not too long ago: On the one hand this makes it difficult to pinpoint a likely trigger – in contrast to the situation prior to the GFC. At the time it was crystal clear that a crisis would most likely be centered on the housing sector and the financial engineering associated with it (OK, it wasn’t clear to Fed officials, politicians, regulators, most mainstream economist and most of Wall Street, but it was definitely clear to people in possession of a modicum of common sense). On the other hand, an ominous implication of the diffuse nature of the bubble is that there will be “no place to hide” when the above-mentioned latent risks materialize. If the oil sector’s problems had emerged amid a lack of system-wide liquidity, they would likely have proved contagious. Rising interest rates and a slowdown in credit growth imply that this precondition is very likely to prevail when the next batch of problems shows up. |
Hussman Strategic Advisors, 1986 - 2017 The “bubble in everything” – on a cap-weighted basis, the market was more overvalued at the peak in 2000, but from a more holistic perspective it has never been more overvalued than today - Click to enlarge |
Bonus Chart: Rate ComparisonThe chart below shows LIBOR, interest paid on bank reserves held at the Fed and the effective FF rate: |
Rate Comparison, Sep 2013 - Jan 2017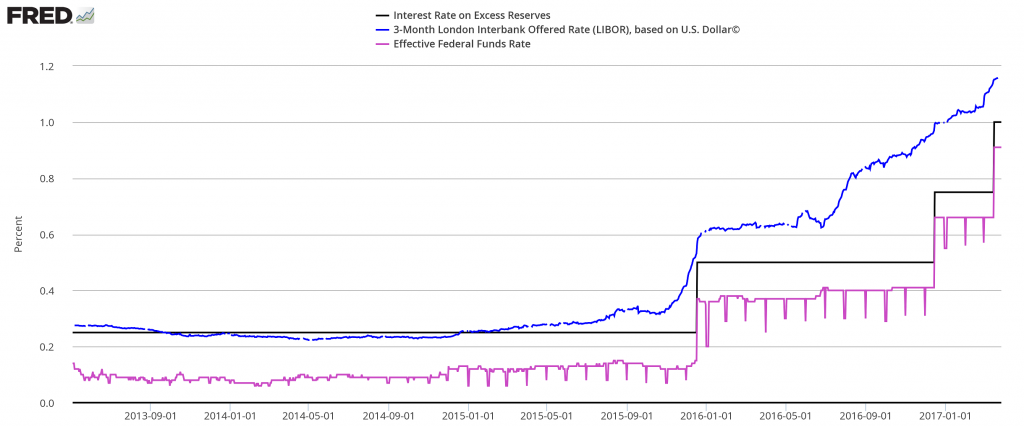 LIBOR (3M) – blue line, IOR – black line, FF rate – purple line. Payment of IOR is what makes it possible for the Fed to hike rates without selling the assets it has accumulated via QE. Allegedly there is a plan to “normalize” the balance sheet, but that would shrink the money supply unless commercial banks were to vastly expand credit at the same time (read: it’s not going to happen) - Click to enlarge |
Charts by: StockCharts, St. Louis Federal Reserve Research, Société Générale, Bloomberg, John Hussman
Full story here Are you the author?
Tags: central-banks,Chart Update,Credit Markets,newslettersent