The Economy and the Stock MarketAs long time readers know, we are always paying close attention to the manufacturing sector, which is far more important to the US economy than is generally believed. In terms of gross output it is the largest sector of the economy, and it should of course be obvious that saving, investment and production are the only ways to create wealth. Contrary to what one often hears from central bankers and their courtier economists, we cannot consume ourselves to prosperity. Rising consumption is a possible effect of economic growth, not a cause of it. Debt-funded capital consumption promoted by loose monetary policy can only lead to impoverishment. |
What’s left of the Brooklyn Domino Sugar Refinery. Photo credit: Paul Raphaelson |
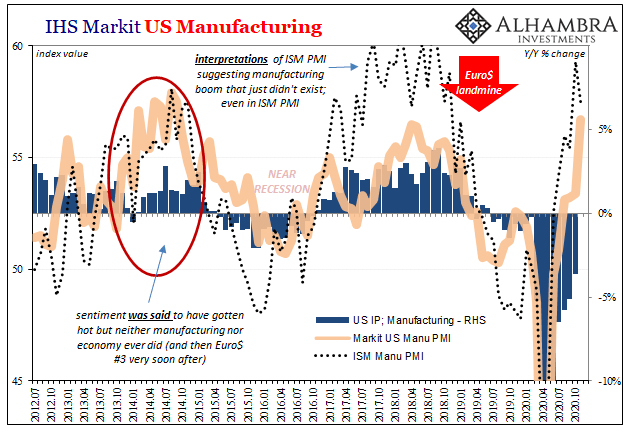
Strikingly weak ISM Purchasing Manager IndicesOur friend Jonathan Tepper of Variant Perception (VP) is doing a lot of excellent and highly creative econometric work. It is strongly focused on the discovery and creation of proprietary leading indicators that can provide actionable information to stock market investors. In the course of an email discussion with him and several others on the above-mentioned topic, he has provided a number of charts developed by VP that bring the current weakness in a number of economic data into context with the stock market’s performance. We felt that one of these charts (which he has created only two days ago), was particularly striking. It shows past instances when both the manufacturing and services ISM headline indexes were below the level of 52 (50 is the threshold between expansion and contraction, readings between 50 and 52 indicate a weak expansion). This state of affairs has recently returned, after both the August manufacturing and services ISM numbers came in well below expectations, with the former actually dipping into contraction territory slightly below the 50 level. It is incidentally quite funny (but not unusual) that the Fed is musing about hiking rates at this particular juncture. Here is Jonathan’s chart: |
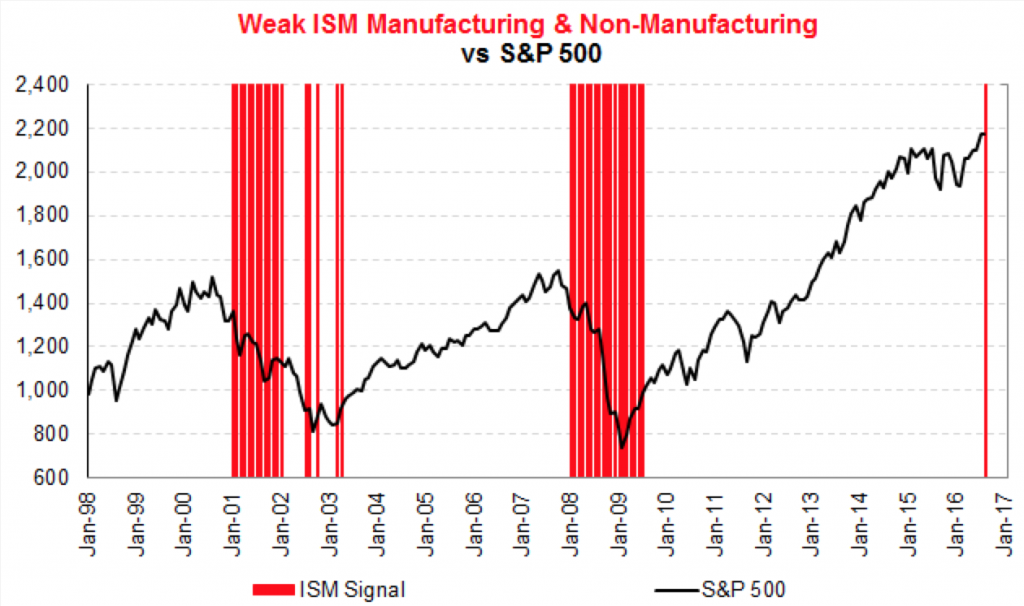 The Variant Perception ISM signal: The red bars indicate times when both the manufacturing and non-manufacturing ISM headline readings were below the level of 52. Evidently, this kind of environment has not been particularly friendly to stock market investors in the past – click to enlarge. The Variant Perception ISM signal: The red bars indicate times when both the manufacturing and non-manufacturing ISM headline readings were below the level of 52. Evidently, this kind of environment has not been particularly friendly to stock market investors in the past – click to enlarge. |
Ample Money Supply GrowthWill brisk money supply growth and ample liquidity combined with financial engineering by listed companies overrule the signal this time? That is of course possible. After all, we only have one reading to go on so far, which may yet turn out to be an outlier (we actually don’t think it is, as it is corroborated by other data as well). In any case, we thought this is a very interesting data point and we will keep readers posted on future developments. At the very least this should be seen as an important heads-up. |
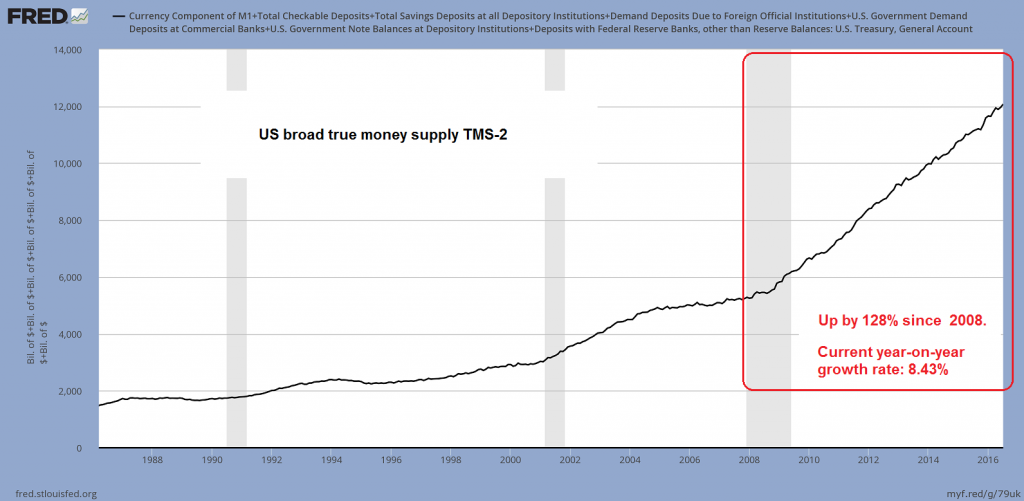 US broad true money supply TMS-2: as of July 2016 its y/y growth rate stands at a brisk 8.43%; since early 2008 it has grown by a cumulative 128%. This is the main driver of asset price inflation – click to enlarge. US broad true money supply TMS-2: as of July 2016 its y/y growth rate stands at a brisk 8.43%; since early 2008 it has grown by a cumulative 128%. This is the main driver of asset price inflation – click to enlarge. |
Conclusion
The stock market can defy economic weakness up to a point, particularly during times of strong money supply growth – but this isn’t going to last if the weakness continues or worsens. Ultimately it will hinge on the state of the economy’s pool of real funding, and all indications are that it is increasingly in trouble.
Charts by Variant Perception, St. Louis Federal Reserve Research
Full story here Are you the author? Previous post See more for Next post
Tags: newslettersent,On Economy,The Stock Market,U.S. ISM Manufacturing PMI,U.S. ISM Non-Manufacturing PMI,U.S. Money Supply


