| According to newly revised BLS benchmarks, the labor market might have been a little bit worse than previously thought during the worst of last year’s contraction. Coming out of it, the initial rebound, at least, seems to have been substantially better – either due to government checks or, more likely, American businesses in the initial reopening phase eager to get back up and running on a paying basis again.
The JOLTS labor series annual revisions took about 300,000 off the estimated level of Job Openings (JO), one way to figure demand for labor, in each March and April 2020. Instead of a bottom just less than a 5 million pace, the government now thinks it was more like 4.63 million. |
JOLTS - Job Openings, SA 2017-2021 |
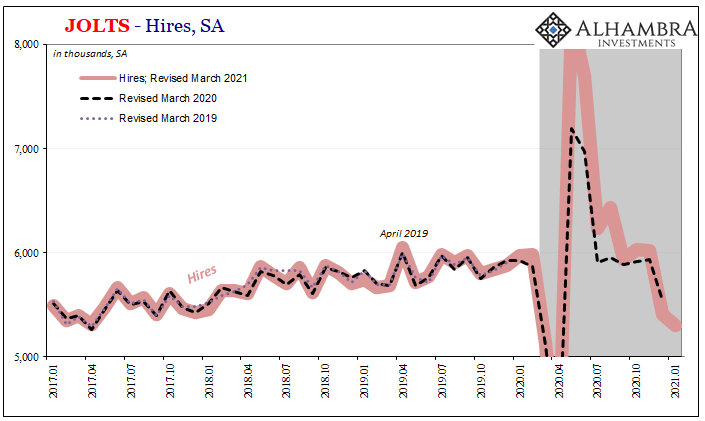
| In terms of Hires (HI), the revision was less, removing only 100k for April. |
JOLTS - Hires, SA 2017-2021 |
|
On the way back out the depths, though, now the BLS calculates HI in May had been simply astronomical; whereas previous they’d put the hiring rate during that month at an impressive 7.2 million, way above records as the flood of reopening worked out to more work, the agency now believes that rate had instead been nearly 8.3 million; an explosive 1.1 million upward revision. This overperformance on the company side remained for a few months toward the rest of the year in the new benchmarks, though becoming far, far less as 2020 wore on. While June’s HI rate was again a million better than previously figured, and in August still around 500,000 higher, by November the difference was less than 100,000 as the labor market cooled way too soon before it ever really got going. |
JOLTS - Job Openings, SA 2000-2020 |
Labor Demand Job Openings, 2013-2021 |
|
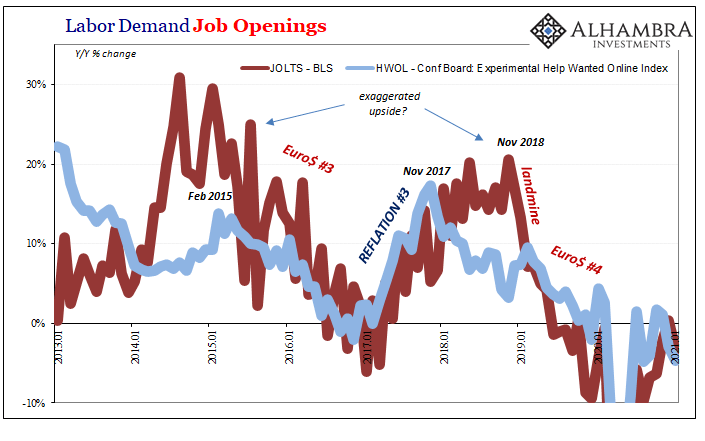
| Job Openings, by contrast, were revised slightly upward toward the end of last year which only brings up the same discrepancies that have plagued these two JOLTS series for several years now. According to JO, companies seem to be posting a lot more online ads for positions they don’t appear intent to fill; or, most likely, they are that much more difficult to fill.
In 2021, the latest update (including benchmarks) for January, the level of JO while better than previously thought are still less than the same month last year (this is also true of the unrelated Conference Board Help Wanted Online index, or HWOL). |
JOLTS - Hires, SA 2000-2020 |
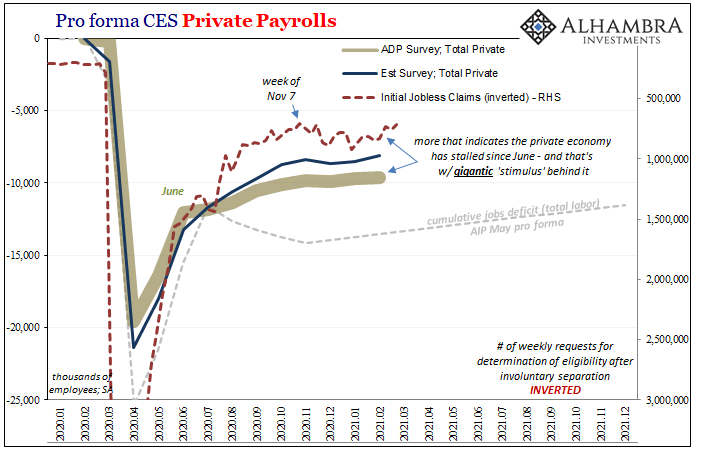
| But while indicated labor demand happened to be slightly less than pre-recession, the hiring rate in January was more than 11% below the year earlier period even with new benchmarks. Using them anyway, the hiring rate in December was actually revised downward by 100k and then for January the estimate dropped by another 100k. These figures are substantially weaker than even the not-so-good headline payroll numbers of the Establishment Survey for the same months (note: benchmark revisions for the CES were already released and, unlike JOLTS, did not indicate major changes).
In other words, the labor market’s rebound got off to a tremendous start (as we knew) but by the end of the year it had actually ended pretty badly. |
|
| Why didn’t the better-than-believed momentum carry much further on?
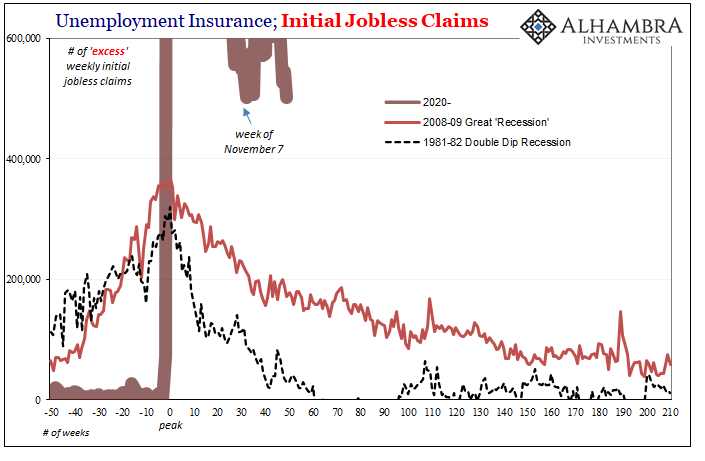
The fact that it didn’t has been simply overshadowed by hopes placed on vaccines and the promises of still more government helicopter drops (one completed late December/early January, no help to either help wanted ads or hiring intentions; the second to begin once the bill is signed tomorrow). Perhaps a touch more optimistically, initial jobless claims for the week of March 6 declined to 712,000. That’s the second lowest since the recession began, yet still the 51st consecutive week at more than 700,000 (no week previous to last March had ever been that high). |
Unemployment Insurance, Initial Jobless Claims, 1981-2020 |
| On the one hand, like the payroll data for February, there’s an inkling of more reopening but questions abound as to the vastly more consequential reawakening. Despite more “stimulus”, if it’s only reopening that contributes and underlying that remains dormant labor demand (meaning hires however many online ads need to be posted to secure them) there’s only going to be a limit on what Uncle Sam’s politically-motivated generosity can achieve.
Even the JO data backs up all the reasons why Americans have opted to save the vast majority of these helicopter payments; the labor market is coming back, for sure, but way, way too slowly to do anything other than hinder rather than amplify rebound or reflationary processes. Companies may be posting a bit more online ads advertising work, but is there actually that much work needing to be done? Is there really even that much demand for labor? As with February payrolls (hours in particular):
This isn’t to say that the US economy appears in looming danger of falling back into contraction like Europe; rather, there isn’t really any distinction. We’ve already got the recession and, contrary to original hype (now increasingly backed by May/June JOLTS data), there have to be reasons why it never went any further. Those may tell us something important about what comes next (inflation vs. more of the same, for example). COVID doesn’t answer for the summer slowdown and its stubbornness – exhibited by payroll estimates, JOLTS series, and jobless claims altogether. |
CES Index of Aggregate Weekly Hours, 2008-2021 |
Full story here Are you the author? Previous post See more for Next post
Tags: currencies,Deflation,economy,Featured,Federal Reserve/Monetary Policy,hires,inflation,Initial Jobless Claims,job openings,jobless claims,jolts,Labor Market,Markets,newsletter


