Before getting into the why of the dollar’s stubbornly high exchange value in the face of so much “money printing”, we need to first go back and undertake a decent enough review of the guts maybe even the central focus of the global (euro)dollar system. I’ve written before that the repo market is the lender of last resort, not central banks. Furthermore, that it’s been fears of a collateral bottleneck which have driven much if not most of what had been Euro$ #4 for years before GFC2 finally proved it.
You have to realize first that collateral is, in many ways, its own currency system. It’s hard to get your head around this, especially since what’s on the other side of repo is cash. How can collateral be more currency-like at times than cash?
This is one key aspect of what I’m calling for in a paradigm shift. Within the old paradigm, the one that still operates as convention, people including all the “experts” operating within it can’t understand nor appreciate this significance; collateral is just shadows dancing on the wall of the cave to them. Forever blind by adhering to that old way of interpreting the world, even some really smart people will end up appearing as bumbling, incoherent idiots.
While we, not they, absorb the consequences.
The collateral regime is its own living, breathing animal. For the global monetary system to expand and therefore allow more economic growth to happen, there needs to be more collateral getting into and redistributed throughout that entire repo framework. You’d think that would mean someone creates more collateral, but that’s not really how it works or where it comes from.
It can, in part, but by and large what does happen instead is a multiplication effect; a collateral multiplier which is a product of money dealers and largely their securities lending businesses.
The term “securities lending” should already clue you in as to the truth behind what I’m saying (as should the historical fact that it was securities lending which nearly brought down AIG, and that it was AIG more than Lehman which was the proximate cause for the worst phase of GFC1). I wrote my typically lengthy essay late last year (back when people were briefly thinking about repo before the Fed’s repo ops which weren’t actual repo ops put everyone back to sleep again; as intended) going over these key concepts:
Starting in 2016, however, things collateral-wise began to pick up for the first time. According to updated estimates from Manmohan Singh, the total volume of pledged collateral grew modestly from $5.8 trillion in 2015 to $6.1 trillion. But with the 2017 introduction of the slogan “globally synchronized growth” and consistent official emphasis on it, the aggregate exploded to $7.5 trillion – an increase of 23% for this money market that hadn’t really seen any kind of growth in nearly a decade.
Of that two-year change, sources of collateral had jumped by $600 billion meaning the velocity also ticked up (to 2.0 from 1.9) accounting for most of that $1.7 trillion rise.
Dealers were back to repledging again! Maybe not in the way they had been before 2008, but certainly over and above the seven years following the crisis.
More importantly, I believe, the sourcing of collateral. The vast majority of it came from the “securities lending” side of things, $400 billion more in 2016 and 2017 compared to $200 billion due to hedge funds.
What was being lent, and to whom or for what? Junk. All kinds of junk, from corporate bonds (since MBS aren’t really an acceptable thing anymore in this context; actually, in large part because MBS haven’t been an acceptable thing since GFC1 and the repo market needed something to replace them) to EM Eurobonds. Things get pledged and repledged, repledged bonds get transformed leading to a whole chain which multiplies and expands the gross collateral pool.
The repo market can then expand and so, too, for a time did the whole global economy. They called it globally synchronized growth but it was more properly classified as just Reflation #3. And the reason for that was this large infection of junk in the collateral stream.
At the slightest disturbance all that transformation activity and securities lending re-pledging (and maybe rehypothecation) would begin to contract back in on itself. Slowly at first, and then, at times like the landmine of late 2018, with increasing speed and ferocity.
Fears of this as-yet unrealized collateral bottleneck had plagued the monetary system since the beginning of 2018. If globally synchronized growth had turned out to be a real thing then that junk wouldn’t have worried anyone; real economic growth makes everything so much less risky. But as it more and more proved to be an illusion, that junk was a ticking time bomb – which everyone in the Treasury (and derivatives markets) knew about.
Curves became more and more distorted as the collateral stream (pool) became harder to negotiate (May 29, 2018, an important clue) under the same 2017-style loose terms. The better forms of it, pristine, would become more and more valuable as the overall collateral pool (therefore entire repo market) began to become more difficult, maybe even to the point of shrinking again (which explained the whole federal funds, repo, IOER fiasco; not irrelevant QT).
What was everyone so afraid of? What was this bottleneck?
That there might come a time when only the best of the best collateral would get the job done, which wasn’t widely enough distributed. If any or much of your funding chains were dependent upon junk, or even just lesser quality issues, there was the material risk that you’d be shut out of repo and therefore left to scramble, with survival on the line, to either buy up usable collateral (the most liquid, meaning OTR meaning T-bills) at any price or fire sale your assets (liquidations) while taking painful potentially fatal losses in the process.
| March 2020, in other words.
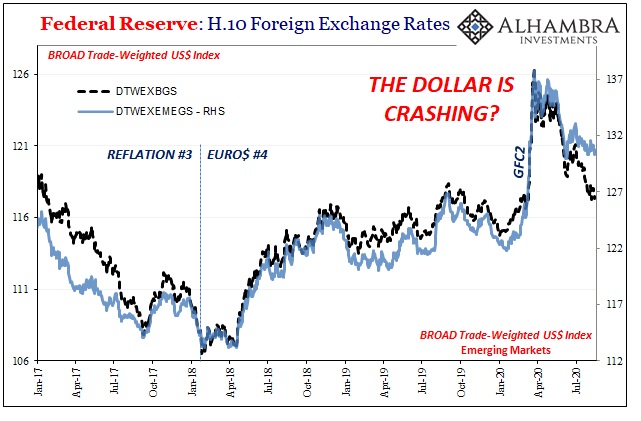
And that’s just how it happened. Not only is the evidence overwhelming, the idiots at the Fed (who can’t see these things for what they are because they are stuck in the old paradigm) even reported as much though they had no idea what to do with the information (unable to interpret it) and therefore what it had really meant or what it might continue to mean. Repo market collateral became so bad, the bottleneck so narrow, that formerly pristine collateral was no longer workable leaving just the most pristine of pristine collateral for the whole system to try to get their hands on. T-bills, in other words. Yields on them during GFC2 driven to seriously negative levels especially during the early morning hours when the previous day’s repo trades were being unwound and the current day’s facing up to that all-too-predictable bottleneck. The thing everyone was on edge about making the world suffer Euro$ #4 had become a reality. Where TIC comes into all this is how it further confirms that explanation as well as the global nature of this money marketplace. Collateral and repo are not simply domestic operations. It was dollar destruction collateral-style; the bottleneck forcing the dollar to shoot destructively higher as the usable pool, therefore the working repo market, grew tighter and tighter and tighter. |
Federal Reserve: H.10 Foreign Exchange Rates, 2008-2020 |
|
It was one key element to the squeeze behind the currency’s exchange value. Everyone needs dollars, the whole world, and suddenly there’s no way to get them unless you’ve got a load of spare T-bills. The hidden thing, repo and collateral, driving the visible thing, the dollar’s exchange rate against the rest of the world. |
Federal Reserve: H.10 Foreign Exchange Rates, 2017-2020 |
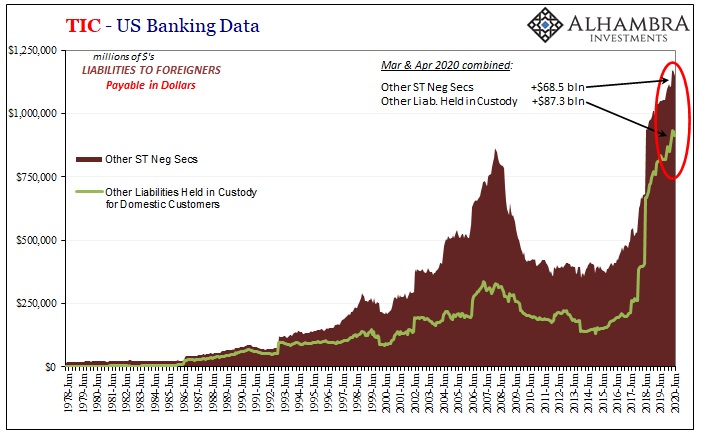
| What does TIC show us? As I’ve been chronicling throughout this now-realized bottleneck, more and more junk appears in the figures (especially via the Cayman Islands) in the form of the worst kind of junk – CLO’s. During March and April 2020, it was an explosion of them. |
TIC - US Banking Data, 1978-2020 |
| As if previously hidden junk perhaps backing transformation chains was being less politely demanded that it began showing up more and more quickly in the visible spectrum of the system’s books. A collateral call, in other words. Maybe even some outright seizures?
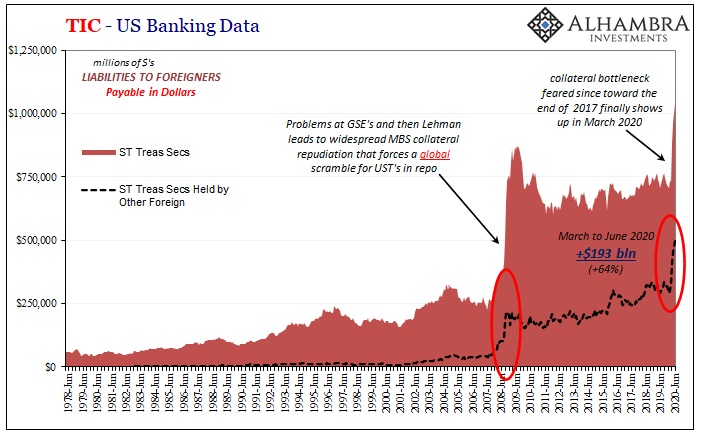
Unsurprisingly given the bottleneck, the other side of that is going to be what TIC calls ST Treasury Securities; ST meaning Short-term. T-bills, in other words. A lot of T-bills, a truly enormous dose (just like GFC1): |
TIC - US Banking Data, 1978-2020 |
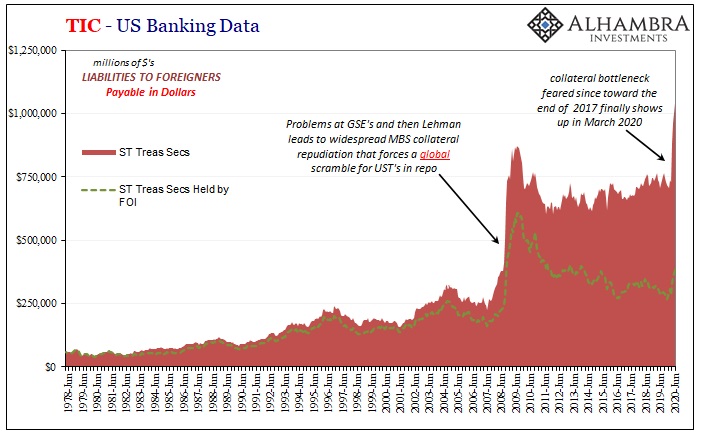
| Now think about exactly what the TIC data is showing you here; especially given the above is what I call the red series referring to US banks who are borrowing from foreign counterparties. All of a sudden, beginning with March 2020 (for obvious GFC-like reasons) US banks began to hurriedly borrow a boatload of T-bills from unknown foreign counterparties classified as “other” kinds of financial institutions in just the same way they had eleven and a half years before.
They also borrowed substantially from Foreign Official Institutions (FOI’s), meaning central banks. More importantly, for our purposes in August 2020 trying to explain why the dollar outside of the euro won’t go down, they have continued borrowing T-bills from these foreign sources all the way through to the end of June (the latest month of data)! Does that sound like Jay Powell’s been effective at, well, anything of true monetary substance? Bank reserves, dollar swaps, and the always-dependable glowing press reports are absolutely no substitute for an expanding and functioning collateral stream; a lesson that should’ve been learned the first time we did this. Dollar destruction, the further potential for more, doesn’t seem to have much abated at least through June. Meaning, that after more than three months of Jay’s “flood” serious, serious problems remain in the one place which is central to, well, basically everything. As had been proved during March. I do realize how even after more than a thousand and a half words to this point already I’m still leaving a lot on the table: Where did these T-bills come from? Where did the CLO’s come from? Where are either of these ending up? Who is borrowing? From whom, these foreign others? Where are all the Eurobonds? How do they get used once they’re borrowed? How might they not get used once they show up in the light of data? |
TIC - US Banking Data, 1978-2020 |
| What the hell is really going on here?
To start with, these are the predictable (and predicted) after effects of the collateral bottleneck, exactly what you’d expect to find once you extricate yourself from the previous paradigm of conventional interpretation. To put it metaphorically: the system had expanded too far based on faulty premises with, as usual, no legitimate backstop behind that expansion. As a consequence, it snapped back and, in the process, destroyed quite a lot. That’s not something you can just clean up with more of the same puppet show. In fact, trying to clean this up with a puppet show is exactly how the last time there was an “L” where a “V” was supposed to have been. The bigger picture is that the monetary system as a whole just doesn’t operate in the way you’ve been told. Furthermore, the people you’ve been led to believe are in charge of it really don’t know what they are doing. It’s not that they’re stupid or evil; for a very long time they actually believed that it didn’t matter. They still believe that today. That’s their paradigm. |
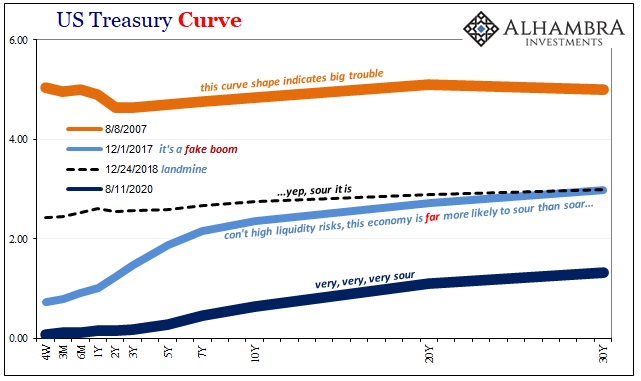
US Treasury Curve, 2007-2020 |
T-bills (bonds and notes to a slightly lesser degree) are one major aspect of the fallout. As is the stubborn dollar. Mainstream commentary, as the stock market, is looking forward as if everything has been summarily handled by the masterstroke of expert central banker hands. As I so often write, how would any of these people know? Shadows on the cave’s wall.
From deep down within the system, it’s nothing like that. Therefore, bond yields. And the dollar outside of the euro, meaning everywhere. Those are what. The shadow world of repo collateral is a big part of why.
Tags: bank reserves,Bonds,collateral,currencies,dollar,economy,EuroDollar,eurodollar system,Featured,Federal Reserve/Monetary Policy,global dollar shortage,jay powell,Markets,money printing,newsletter,repo,stocks,tic,treasury bills,U.S. Treasuries


