Marc Chandler
My articles My offerMy siteAbout meMy videosMy books
Follow on:LinkedINTwitterSeeking AlphaAmazon
![]() Introduction by
Introduction by
George Dorgan
My articles
My siteAbout meMy videosMy books
Follow on:LinkedINTwitterSeeking Alpha
CFA SocietyEconomicBlogs
Summary:
European equities peaked earlier and have fallen the furthest.
MSCI EM equities faring the best, and as of now, they are still up on the year.
MSCI Asia Pacific fell 3.4% today and is now down 0.33% for the year.
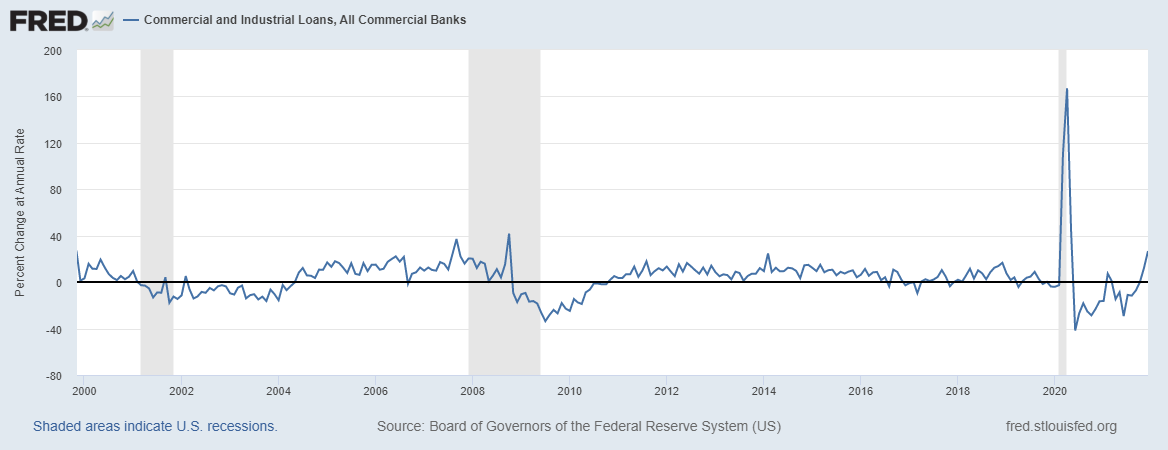
| This Great Graphic was composed on Bloomberg. It shows four stock indices’ performance since the start of the year. It is indexed so that each index started the year at 100.
The yellow line is the Dow Jones Stoxx 600, a benchmark of European shares. It peaked a few days before the other markets and has fallen the furthest. The fuchsia line is the MSCI Emerging Market equity index. It peaked the same day as the S&P 500 (white line), but has held up the best and is still up 1.2% year-to-date. The green line is the MSCI Asia Pacific Index. Today’s 3.4% decline puts it about 0.3% lower year-to-date. Of course, the chart is incomplete, insofar as today’s action is not complete. The S&P has been choppy, and is currently about 0.4% lower. Latin American markets may take a toll on the MSCI EM equity index. European markets are off their lows, but are also struggling to maintain any meaning upside momentum. US leadership may be awaited. |
SPX Index, Dec 2017 - Feb 2018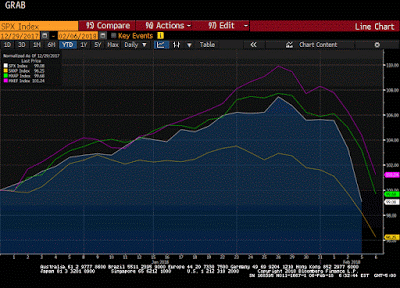 - Click to enlarge |
Full story here Are you the author?
Tags: Emerging Markets,equities,Great Graphic,newslettersent,SPY