Investors and businesses are wrestling with conflicting impulses. On the one hand, economic growth seems sufficiently strong to allow the Federal Reserve, European Central Bank, and the Bank of England to continue to counter elevated price pressures. They are set to hike rates next month. On the other hand, last month's banking stress is seen translating to a lower and sooner peak in policy rates.
Before the bank stress emerged, the market had priced in a peak Fed funds rate of nearly 5.75%. Now, the May hike to 5.25% is expected to be the top. We suspect the market is under-appreciating the risk of a hike after May. Moreover, Fed funds futures strip is pricing in a cut by the end of Q3 and sees the year-end rate near 4.50%. Similarly, the swaps market had the ECB's target rate rising to 4.0% by the end of September, and now it sees the peak between 3.50% and 3.75%. The market thought the Bank of England's base rate would top out between 4.75% and 5.0% in Q4 22. Now, pricing in the swaps market sees the peak likely at 4.50%-4.75%.
This week's US data pale in comparison to the March jobs, CPI, and retail sales reports seen recently. March housing starts and permits and existing home sales are featured. The April NY Fed's manufacturing and Philadelphia Fed surveys are also on tap. The Fed's Beige Book in preparation for the May 2-3 FOMC meeting will be reported on April 19. China reports Q1 GDP figures and details on April 18. The UK reports its latest employment data on the same day. The following day, the UK reports March CPI and then retail sales ahead of the weekend. The Bank of Canada, which lefts rates on hold last week, sees March CPI figures on April 18. Japan reports March CPI on April 21. The highlight for the eurozone and several large countries will be the preliminary estimate of April's PMI on April 21.
United States: The US economy expanded by 2.6% at an annualized rate in Q4 and the latest Bloomberg survey conducted at the end of last month found a median forecast of 1.3% (up from 0.5% in the February survey). The Atlanta Fed's GDP tracker puts Q1 growth at 2.2%. The median forecast in the Fed's March Summary of Economic Projections was for growth to by 0.4% year-over-year in 2023. Note that in December, the median GDP forecast was 0.5%. This is more pessimistic than many seem to realize and may be consistent with no growth in for Q2-Q4 this year. The FOMC minutes from last month's meeting showed that the staff forecasts for a mild recession later this year is not as startling as it may seem. The media coverage of the Fed's staff warning of a mild recession later this year seems sensationalist.
Even though core inflation ticked up in March, the market is convinced after a May 3 hike, which will bring the upper end of target range to 5.25%, the Federal Reserve is done. The year-end rate is seen near 4.35% (putting the year-end policy rate between 4.25% and 4.50%, which continues to seem aggressive. The banking stress remains contained. The KBW bank index rose almost 3.2% last week, and emergency borrowing from the Federal Reserve continued to slow gradually. Earnings from several of the large banks for Q1 beat expectations. US bank deposits rose (~$60 bln) in the week ending April 5, which was roughly evenly divided between small and large banks. And after falling by $68 bln in the last two weeks of March, commercial and industry loans increased by $6.7 bln.
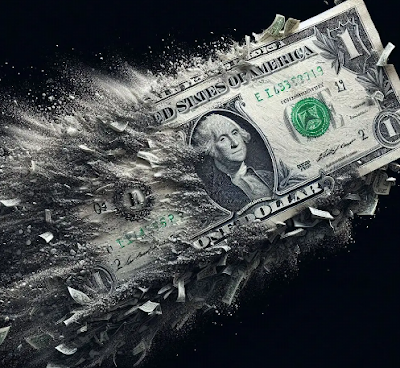
The Dollar Index set a new 12-month low ahead of the weekend,, near 101.80. From March's high for the year near 105.90 to last week's low, the Dollar Index fell about 4.85%. It frayed the lower Bollinger Band, and the Slow Stochastics did not confirm the new low in price, leaving a potential bullish divergence in its wake. The Dollar Index posted a potential key upside reversal before the weekend. After falling to new lows, it recovered and settled above the previous day's high. It continues to look oversold but need to push back above 102.00 to be meaningful. On the downside, the next important chart area is near 100.00 and then the (61.8%) retracement of its rally from early 2021, a little below 99.00.
China: China's highlight is Q1 GDP. After stagnating in Q4 22, the world's second-largest economy is expected to have expanded by 2.1% quarter-over-quarter in Q1 23. Industrial production and retail sales are seen accelerating in March, while property investing likely extended the decline that began last April. The recovery in the economy takes pressure off officials to provide more monetary support. While many economists seem doubtful that Beijing's GDP goal of around 5% will be achieved this year, we are somewhat less skeptical and note that the IMF's new forecast is for 5.8% growth in 2023. The benchmark one-year medium-term lending rate was maintained at 2.75% last week, and that means that the one- and five-year loan prime rates will likely be kept steady at 3.65% and 4.30%, respectively. The dollar has traded between about CNY6.8170 and CNY6.9070 for the past month. It fell to three-week lows (~CNY6.8320) ahead before the weekend before recovering to it the CNY6.87 area. By rule of alternation, after testing the lower end of the range, it may test the upper end in the coming days.
Japan: Two data points in Japan stand out while acknowledging that the (preliminary) PMI typically draws scant attention. First, Japan reports the March trade balance. There still are references to Japan's export orientation or dependency. However, consider that in the decade through last December, Japan reported an average monthly merchandise trade deficit of nearly JPY375 bln (~$3.37 bln at the average exchange rate of JPY111.50). It also runs a chronic deficit on the services account. In the Jan-Feb, Japan reported a merchandise trade deficit of JPY3.01 trillion compared with a JPY1.75 trillion deficit in the year ago period. Second, Japan reports March CPI on April 21. The Tokyo figures, reported last month, offer a close guide to the national report. After falling sharply in February, as the government's subsidies registered, Tokyo consumer prices at the headline and core slipped by 0.1% to 3.3% and 3.2%, respectively. However, more worrisome for the new leadership team at the Bank of Japan was news that the measure excluding fresh food and energy accelerated to 3.4% from 3.1% year-over-year, a new cyclical high. This measure on the national level accelerated to 3.5% in February from 3.2% in January and 3.0% at the end of last year.
Changes in the exchange rate and the US 10-year yield are 0.60 correlated over the past 60 days. This the most since January 2022. The correlation weakened after the BOJ surprised the market last December by widening the 10-year band to 0.50% but has completely recovered. The correlation between changes in the exchange rate and the US 2-year note yield is a bit higher at 0.67 and that is the highest since March 2020. The correlation between the exchange rate and Japan’s 10-year yield is negligible. The new BOJ leadership is in place, and it sounds a lot like the old. Governor Ueda and a deputy’s comments have suggested no strong urgency to change policy. The greenback found support near the 20-day moving average last week, which begins the new week near JPY132.15. On the upside, it struggled in the JPY133.80-JPY134.00 area and has not traded above JPY135.00 since March 10.
Eurozone: The trade shock was becoming evident before Russia invaded Ukraine. The three-month average surplus peaked at the end of 2020 near 27.6 bln euros. In the last three months of 2021, the trade surplus averaged 9.7 bln euros. The trade balance was mostly in deficit in 2022, with the peak in August near 52.3 bln euros. The eurozone's trade balance always (no exceptions since the birth of the euro) improves in February from January. The January shortfall was 30.6 bln euros and may have fallen by as much as two-thirds. Bloomberg's month survey in March showed economists may still be too pessimistic toward the eurozone economy, with the median forecast looking for a 0.1% contraction in Q1 after a stagnant Q4 22. The eurozone composite PMI average 52.0 in Q1 23 after 48.1% in Q4 22 and 49.0 in Q3 22. Comments from hawkish ECB members spurred the swaps market to increase the chances of a 50 bp move next month. About a 1-in-4 chance of it has been discounted. That helped lift the euro to new highs for the year ahead of the weekend near $1.1075 before pulling back in North American dealings. The momentum indicators have been stretched by the euro's seven-week rally. We suspect it can test the $1.0925-50 area and still not inflict much technical damage. A break could signal a move to the $1.0860 and possibly $1.08.
United Kingdom: The British economy is doing better than expected at the start of the year, and the Tory Party has narrowed the gap with Labour. Speculation of a general election middle-to-late next year has begun (it must be held by late January 2025). The UK reports on the labor market, inflation, and retail sales in the coming day and the flash PMI. The modest strength of the underlying economy and elevated price pressures encourage speculation of another Bank of England rate hike when it meets on May 11. After spending the six months through January below the 50 boom/bust level, the UK's composite PMI jumped to 53.1 in February and eased to 52.2 in March. Sterling made a new high since last June before the weekend ($1.2545) and reversed lower. It settled below the previous day's low (~$1.2480) to post a potential key reversal. The momentum indicators did not confirm the new high and this divergence is seen as bearish. A break of the $1.2345-75 area would warn of a "proper" correction that could extend toward $1.2175-$1.2200.
Canada: The Bank of Canada left rates on hold last week, as widely expected. It seems to be more confident of a soft economic landing. The central bank recognized that tighter credit conditions will likely restrain growth in the US and Europe. Although the Canadian economy was stronger than expected in Q1. It now estimates 2.3% annualized growth in Q1, up from 0.5% projected in January and sees Q2 slowing to 1.0%. The Bank of Canada expects growth will be "weak" for the remainder of the year. March CPI will be reported on April 18. In February, it was 5.2%. It peaked at 8.1% last June. The Bank of Canada forecast its it to fall to 3.5% this year and 2.3% next year. The median and trimmed measures of core inflation have fallen below 5.0%. The Bank of Canada does not meet again until June 7, and the swaps market continues to price in a cut before the end of the year. Canada reports February retail sales on April 21. After the heady 1.4% increase in February, a modest pullback is likely, though they have been blunted by a pick-up in auto sales.
The US dollar fell from a peak near CAD1.3550 at the start of last week to almost CAD1.3300 ahead of the weekend. It closed below the 200-day moving average (~CAD1.3400) for the first time since last June. It looks to have put in a bullish hammer candle stick pattern before the weekend. The CAD1.3400 area also houses the (38.2%) retracement of the greenback's decline last week. Above there, the next corrective targets are around CAD1.3430 and CAD1.3460.
Australia: The Reserve Bank of Australia paused its tightening cycle. Similar to how the Bank of Canada's pause has been interpreted by the market, the pause is seen as the peak in the cash rate (3.60%.). The futures market has a 20 bp cut discounted by the end of the year. The minutes from the RBA meeting will be released on April 18 and the market will be looking for confirmation that the bar to resuming tightening is high. Unlike most other G10 economies, Australia's composite PMI struggled in Q1. The push above 50 in February proved premature, and it fell back to 48.5 in February. It averaged 49.2 in Q1 23 after averaging 48.4 in Q4 22. The Australian dollar poked briefly above $0.6800 ahead of the weekend for the first time since late February but reversed lower. It tested the $0.6735 area, which is the (38.2%) retracement of the rally from the April 10 low near $0.6620. The fraying of support at $0.6700 weakens the tone and points to a risk of a test on the lower end of its six-week range (~$0.6565-$0.6600).
Mexico: Investors may not look very favorably at President AMLO's policies, but with the high interest rates and proximity to the US amid near-shoring and friend-shoring memes, the peso is among the best performing currencies this year, appreciating around 7.3% against the greenback. A bright spot for Mexico has been auto production. The three-month average rose nearly 16% in Q1 23 after falling almost 6.5% in Q4 22. Mexico's Q1 22 average vehicle production rose by about 11% in Q1 22. Mexico reports February retail sales (April 20) and after a strong 1.6% rise in January, a small pullback should not be surprising. Inflation for the first half of April will be reported at the end of the week. The pace has slowed without fail since the second half of January. During this span, it has fallen from 7.94% to 6.58%. The core rate is considerably stickier. It was slightly above 8% in the second half of March, which was the lowest since last June. The peso appears to be losing some of its luster. Other high-yielding regional currencies outperformed it. And again, the dollar found bids when it dipped below MXN18.00. At best, the price action seems to be suggesting a period of consolidation. A move above MXN18.13 could signal greenback gains to the upper end of this month's range near MXN18.40.
Full story here Are you the author? Previous post See more for Next post
Tags: Currency Movement,Featured,macro,newsletter


