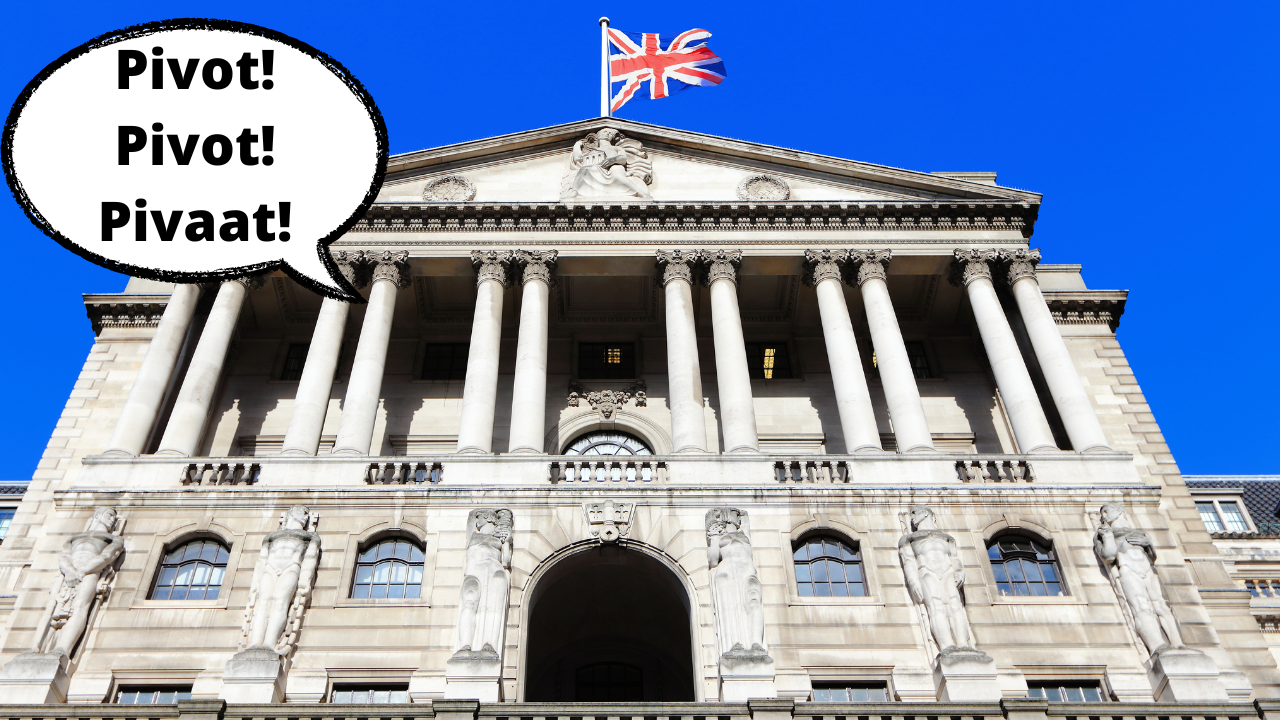
This morning the UK pound slumped as one of the world’s oldest central banks pressed hard on the panic button. The Bank of England was seen to be shouting ‘Pivot! Pivot! Pivaat!’ as they announced they would temporarily suspend their programme to sell gilts and will instead buy long-dated bonds.
In a statement, the bank said that they would be embarking on a “temporary and targeted” bond buying operation.
Although we expect it to be about as temporary and as targeted as a toddler with a paint gun. Unsurprisingly the markets did not see this as a vote of confidence in the British economy and almost anything associated with the former Empire has taken a beating.
What caused the Bank of England to act so hard and so fast?
Unsurprisingly, markets were unimpressed. According to Tradeweb data, the 30-year gilt rates had their largest one-day decline ever as they dropped 0.75 percentage points to 4.3% from an earlier 20-year peak above 5%.
Yields decrease when prices increase. Ten-year rates decreased from 4.59 percent to 4.1%.
What caused the Bank of England to act so hard and so fast? An attempt to prevent the wholesale equivalent of the run that destroyed Northern Rock in 2008. It now seems to be common knowledge that there was a ‘run dynamic’ on pension funds.
Following severe declines in the value of the pound and the price of gilts, UK pension funds have received variation margin calls totaling up to £100 million ($107 million) each.
As a result, mark-to-market valuations on derivatives and leveraged repo positions have been heavily skewed against them. Such margin calls were set to cause mass liquidation on pension funds had the central bank not intervened.
This, along with the U.K. government’s proposed tax cuts on the heels of the Federal Reserve increasing its projections for interest rate increases are the latest three things in a long string of central bank and government actions that have markets dizzy with uncertainty.
However, the Bank of England’s announcement today gives its first-mover status as a central bank that has done what many of us saw as inevitable – take an about turn from QT to QE.
| Today’s moves by the Bank of England might set it as the first to stop QT, but it certainly won’t be the last. Central banks around the world are struggling with a major dilemma: should they fight inflation risking a global depression like we’ve never seen before, or work to support economic recovery with hyperinflation a constant backdrop?
This was the second move by the UK, in less than a week to try and stave off total currency and economic collapse. Markets reacted swiftly to the U.K. government’s announcement on Friday to cut taxes and provide energy subsidies.
The plan, right out of the Reaganomics textbook of the 1980s, among other things scraps the highest income-tax rate and is aimed to stimulate stagnating U. K. growth to try and avoid a deep recession.
The combination of the Bank of England not matching other central bank interest rate hikes and the tax cuts have increased inflation expectations. |
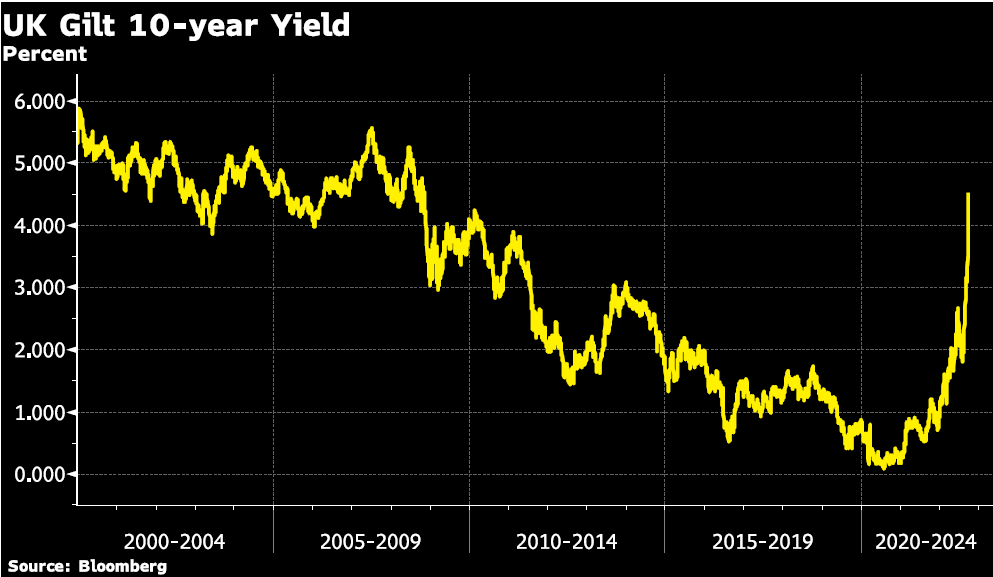 UK Gilt 10- Year Yield Chart |
| The surge in yields has close to a third of U.K.’s safest bonds sending off distress signals. It’s a sign of just how troubled a market is when the price of roughly a third of the safest sterling corporate bonds drops into distressed territory, compared to just one at the end of last year …
Most of the jump in the number of distressed bonds happened in the two days through Monday, triggered by the government’s plan to fund the nation’s biggest tax cuts in 50 years through more borrowing.
While the UK credit market was already having a difficult year, the selloff recently, particularly in the pound and government debt, put sterling notes at the center of the world’s worst bond selloff in decades.
The moves this past week have dragged the overall index price to within a few pence of distress, but it’s worth noting that not a single bond’s spread is above 1,000 basis points, another measure of distressed debt. (Bloomberg, 09/27). |
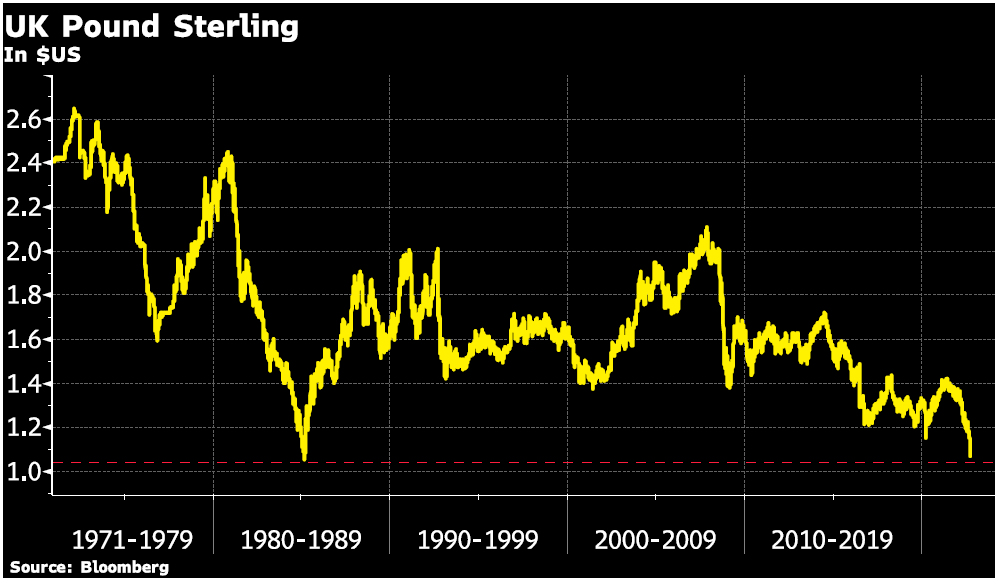 UK Pound Sterling Chart |
| The pound was already in a steady slide against the dollar before last week. This was mostly due to the combination of pressure from high energy prices widening the U.K. trade deficit and more aggressive Federal Reserve rate hikes drawing investors towards U.S. dollars.
Even prior to the UK’s reactionary announcements in the last week, it was already declining against the dollar.
But, it is not the only currency doing so, however. Japan intervened in the currency markets last week for the first time since the 1998 Asian financial crisis in order to help prop up the declining yen.
The euro and Chinese renminbi have also declined against the dollar since the Fed started hiking interest rates in March. Note that gold has held its value in the surging U.S. dollar environment since March better than other currencies! |
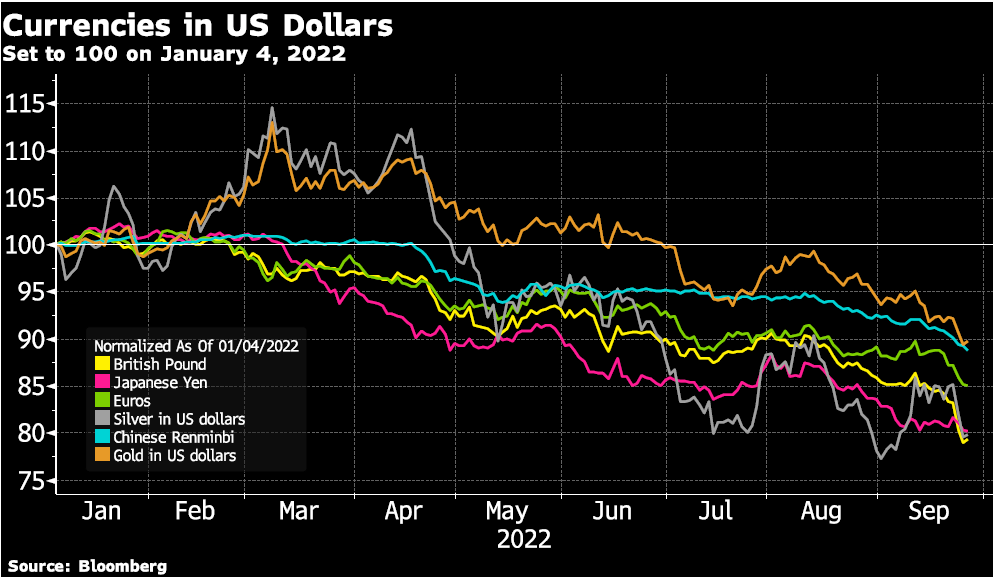 Currencies in US Dollars Chart |
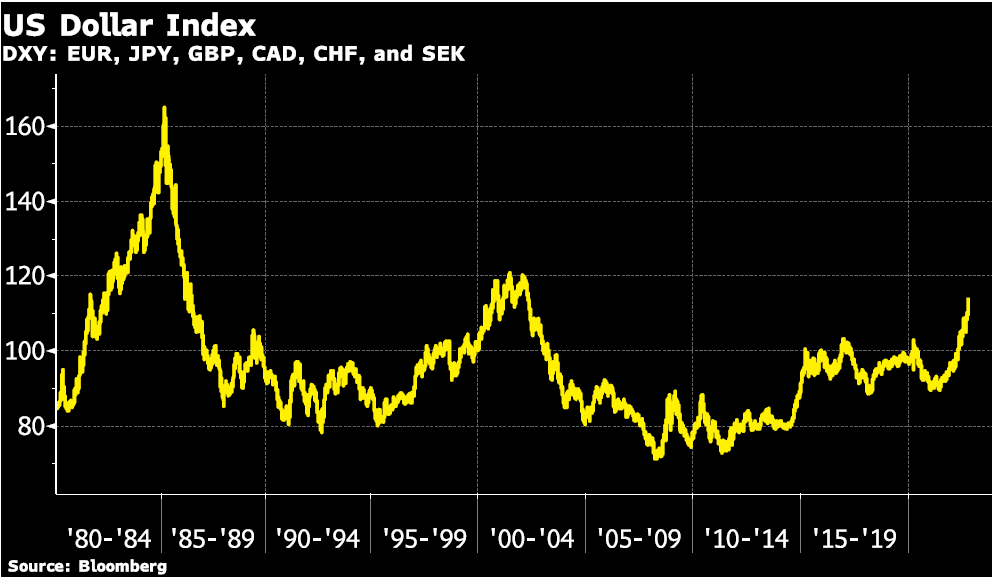
| The U.S. dollar (DXY index) has surged 19% since the beginning of 2022 and more than 25% since May 2021. Large surges in the U.S. dollar have ended in crisis or taken international agreements to bring down.
The rise in the U.S. dollar from 1995 to 2002 coincided with the Asian financial crisis in 1997 and the Dot-com bubble bursting in 2000.
The early 1980s major surge in the dollar resulted in the Plaza Accord in 1985 (named for the signing at the Plaza Accord hotel in New York City).
The Plaza Accord was an international agreement between France, West Germany, Japan, the U.K., and the U.S. to depreciate the U.S. dollar. Under the Plaza accord leaders of the five governments promised to carry out a policy that would bring down the U.S. dollar’s value.
For its part the U.S. promised to reduce its deficit, Germany promised tax cuts, and Japan promised looser monetary policy. Not all of the promises were kept of course, but the agreement did result in a decline in the U.S. dollar.
The U.S. dollar declined so much in fact that in 1987 the Louvre Accord then replaced the Plaza Accord.
Under the Louvre Accord, which also included Canada, governments set ranges and promised to intervene if their currencies moved outside of those ranges.
Many analysts attribute the agreements as the main cause of Japan’s asset price bubble that built from 1986 to 1991 and then the subsequent crash in 1992. |
 US Dollar Index Chart |
As economic growth slows, competing interests between central banks and governments are going to come to the forefront as governments scramble to support growth and central banks battle inflation.
Why did the dollar rise in the 80s?
So, what caused the rise in the U.S. dollar in the 1980s in the first place? – the competing policies of a Paul Volcker led Fed tightening policy and the expansionary policies of the U.S. Administration, lead by none other than Ronald Reagan.
The slowdown in economic activity has not raised the unemployment rate in the U.S. yet. However, when it does the U.S. administration is likely to follow the U.K. government’s lead and announce stimulative measures to support the economy. Especially as the 2024 election approaches which will then put even more upward pressure on the U.S. dollar.
It seems unlikely in today’s climate to get governments to come together for a Plaza Accord-type agreement, which leaves a currency war as the likely outcome.
Keep holding physical gold and silver while the storm is brewing!
As expected, the price of gold reacted positively to the drop in the pound, so intuitive it is to central bank disaster policies. To hear more of our insights into the gold price and the geopolitical environment, why not check out the latest episode of The M3 Report where we discuss the energy crisis and the impact of sanctions on Russia.
Full story here
Are you the author?
Stephen Flood is the CEO of GoldCore. He is a former Wall Street equity trader and FinTech expert. He has been involved in the precious metals markets since 2004 and has appeared as an expert contributor on CNBC, CNN, BBC, RTE & Bloomberg TV and has had articles published in the Irish Times, Irish Independent and The Sunday Business Post.
Previous post
See more for 6a.) GoldCore
Next post
Tags:
Bank,
Bank of England,
Commentary,
Economics,
Featured,
Gold,
inflation,
Interest rates,
Latest news,
News,
newsletter
 On Swiss National Bank
  Main SNB Background Info
  Wenig Gehalt, trotzdem glücklich?
 unknown
 Gibt es den Cost-Average-Effect? Saidi zerlegt diesen Finanz-Mythos
 Eilmeldung: Attentat auf Trump: Täter in Mar-A-Lago getötet!
 Eilmeldung: Supermarkt Fachkraft für Warenverräumung fleißig bei der “Arbeit”!
 Die Performance der Kryptowährungen in KW 8: Das hat sich bei Bitcoin, Ether & Co. getan
 Robert Fico stellt Ultimatum an Selenski: “In 12 Stunden ist dein Strom weg!”
 EL SALVADOR NO HA PERDIDO AÑOS DE CRECIMIENTO
 Eil: Total-Schaden für IG Metall: Mitglieder flüchten in Scharen!
 unknown
 Die Performance der Kryptowährungen in KW 8: Das hat sich bei Bitcoin, Ether & Co. getan
 Switzerland, the country of four seas
 The Business Cycle Narrative & War With Iran
 Bitcoin causes 114 million tonnes of CO2 per year
 Bezos AI firm ‘Project Prometheus’ opening Zurich office
 Salvage begins of Swiss train derailed by avalanche
 Tariff Decision Day?
 4 Percent Inflation: The Case For And Against
 Money: The 10 Immutable Laws Of Building Wealth
 Could direct democracy trip up Swiss trade deals?


Ross Geller inspires Bank of England policy
Published on September 29, 2022
Stephen Flood
My articles My videosMy books
Follow on:
This morning the UK pound slumped as one of the world’s oldest central banks pressed hard on the panic button. The Bank of England was seen to be shouting ‘Pivot! Pivot! Pivaat!’ as they announced they would temporarily suspend their programme to sell gilts and will instead buy long-dated bonds.
In a statement, the bank said that they would be embarking on a “temporary and targeted” bond buying operation.
Although we expect it to be about as temporary and as targeted as a toddler with a paint gun. Unsurprisingly the markets did not see this as a vote of confidence in the British economy and almost anything associated with the former Empire has taken a beating.
What caused the Bank of England to act so hard and so fast?
Unsurprisingly, markets were unimpressed. According to Tradeweb data, the 30-year gilt rates had their largest one-day decline ever as they dropped 0.75 percentage points to 4.3% from an earlier 20-year peak above 5%.
Yields decrease when prices increase. Ten-year rates decreased from 4.59 percent to 4.1%.
What caused the Bank of England to act so hard and so fast? An attempt to prevent the wholesale equivalent of the run that destroyed Northern Rock in 2008. It now seems to be common knowledge that there was a ‘run dynamic’ on pension funds.
Following severe declines in the value of the pound and the price of gilts, UK pension funds have received variation margin calls totaling up to £100 million ($107 million) each.
As a result, mark-to-market valuations on derivatives and leveraged repo positions have been heavily skewed against them. Such margin calls were set to cause mass liquidation on pension funds had the central bank not intervened.
This, along with the U.K. government’s proposed tax cuts on the heels of the Federal Reserve increasing its projections for interest rate increases are the latest three things in a long string of central bank and government actions that have markets dizzy with uncertainty.
However, the Bank of England’s announcement today gives its first-mover status as a central bank that has done what many of us saw as inevitable – take an about turn from QT to QE.
This was the second move by the UK, in less than a week to try and stave off total currency and economic collapse. Markets reacted swiftly to the U.K. government’s announcement on Friday to cut taxes and provide energy subsidies.
The plan, right out of the Reaganomics textbook of the 1980s, among other things scraps the highest income-tax rate and is aimed to stimulate stagnating U. K. growth to try and avoid a deep recession.
The combination of the Bank of England not matching other central bank interest rate hikes and the tax cuts have increased inflation expectations.
UK Gilt 10- Year Yield Chart
Most of the jump in the number of distressed bonds happened in the two days through Monday, triggered by the government’s plan to fund the nation’s biggest tax cuts in 50 years through more borrowing.
While the UK credit market was already having a difficult year, the selloff recently, particularly in the pound and government debt, put sterling notes at the center of the world’s worst bond selloff in decades.
The moves this past week have dragged the overall index price to within a few pence of distress, but it’s worth noting that not a single bond’s spread is above 1,000 basis points, another measure of distressed debt. (Bloomberg, 09/27).
UK Pound Sterling Chart
Even prior to the UK’s reactionary announcements in the last week, it was already declining against the dollar.
But, it is not the only currency doing so, however. Japan intervened in the currency markets last week for the first time since the 1998 Asian financial crisis in order to help prop up the declining yen.
The euro and Chinese renminbi have also declined against the dollar since the Fed started hiking interest rates in March. Note that gold has held its value in the surging U.S. dollar environment since March better than other currencies!
Currencies in US Dollars Chart
The rise in the U.S. dollar from 1995 to 2002 coincided with the Asian financial crisis in 1997 and the Dot-com bubble bursting in 2000.
The early 1980s major surge in the dollar resulted in the Plaza Accord in 1985 (named for the signing at the Plaza Accord hotel in New York City).
The Plaza Accord was an international agreement between France, West Germany, Japan, the U.K., and the U.S. to depreciate the U.S. dollar. Under the Plaza accord leaders of the five governments promised to carry out a policy that would bring down the U.S. dollar’s value.
For its part the U.S. promised to reduce its deficit, Germany promised tax cuts, and Japan promised looser monetary policy. Not all of the promises were kept of course, but the agreement did result in a decline in the U.S. dollar.
The U.S. dollar declined so much in fact that in 1987 the Louvre Accord then replaced the Plaza Accord.
Under the Louvre Accord, which also included Canada, governments set ranges and promised to intervene if their currencies moved outside of those ranges.
Many analysts attribute the agreements as the main cause of Japan’s asset price bubble that built from 1986 to 1991 and then the subsequent crash in 1992.
US Dollar Index Chart
As economic growth slows, competing interests between central banks and governments are going to come to the forefront as governments scramble to support growth and central banks battle inflation.
Why did the dollar rise in the 80s?
So, what caused the rise in the U.S. dollar in the 1980s in the first place? – the competing policies of a Paul Volcker led Fed tightening policy and the expansionary policies of the U.S. Administration, lead by none other than Ronald Reagan.
The slowdown in economic activity has not raised the unemployment rate in the U.S. yet. However, when it does the U.S. administration is likely to follow the U.K. government’s lead and announce stimulative measures to support the economy. Especially as the 2024 election approaches which will then put even more upward pressure on the U.S. dollar.
It seems unlikely in today’s climate to get governments to come together for a Plaza Accord-type agreement, which leaves a currency war as the likely outcome.
Keep holding physical gold and silver while the storm is brewing!
As expected, the price of gold reacted positively to the drop in the pound, so intuitive it is to central bank disaster policies. To hear more of our insights into the gold price and the geopolitical environment, why not check out the latest episode of The M3 Report where we discuss the energy crisis and the impact of sanctions on Russia.
Full story here Are you the author?Follow on:
No related photos.
Tags: Bank,Bank of England,Commentary,Economics,Featured,Gold,inflation,Interest rates,Latest news,News,newsletter