


Marc Chandler
My articles My offerMy siteAbout meMy videosMy books
Follow on:LinkedINTwitterSeeking AlphaAmazon
 The highlights of September include continued substantial rate hikes by the major central banks, save Japan. The Tories will pick a new leader, who will become the next prime minister of the UK. Italy looks determined to have a right-wing government. Sweden goes to the polls in mid-September. The price of defeating the Social Democrats, who have governed since 2014, maybe for the center-right to form an alliance with the nationalist Sweden Democrats. Like Brother of Italy, it has far-right and neo-fascist roots and has emerged as the largest opposition party. In Denmark, the coalition government appears to be fracturing, and a snap election could be called. Also, the US midterm election in November begins coming into focus.
Central banks have come under widespread criticism for letting inflation surge, not appreciating its persistence, and being generally too timid when they did move. However, they are demonstrating their resolve by hiking rates aggressively in the face of a dramatic slowdown, which many expect is a prelude to recession. When push comes to shove, central bankers are more worried about the ruinous effects of inflation than a cyclical economic downturn. Surveys suggest many businesses agree. For now, only the Bank of England forecasts a recession and sees the British economy contracting next year and in 2024.
The market resisted the official attempt to tighten financial conditions. Between mid-June and mid-August, the S&P 500 rallied almost 19%. The 10-year US Treasury yield fell from 3.5% in mid-June to nearly 2.50% by early August. Europe’s Stoxx 600 rose more than 11% from late June through mid-August, while the yield on the German 10-year Bund tumbled from above 1.90% in mid-June to less than 0.68% in early August.
However, officials pushed back, and the markets capitulated in the second half of August. Stocks swooned, and yields surged. In the US, the market priced in a hike in Q1 23 and took out all but the slightest chance of a cut next year. Record inflation has spurred the swaps market tto price in a 75 bp ECB hike in early September. The Bank of Canada surprised with a 100 bp hike in July, and the market has discounted a 75 bp move for this month.
It is fashionable to play up the aggressively stimulative policies in explaining inflation. However, after the Great Financial Crisis, there were similar warnings about a price surge that never materialized. Even now, the relationship between inflation and the size of central bank balance sheets, the general government’s deficit, and debts is not clear-cut. Note that Japan’s July CPI stood at 2.6%, the US at 8.5%, and the eurozone at 9.1%, and this assumes that there is an agreed composition and weightings of CPI, which there isn’t.
The Bank of Japan’s balance sheet is nearly 135% of GDP. The Fed’s balance sheet is about 36.5% of GDP. The ECB’s balance sheet is almost 69% of GDP.
Japan’s central government debt is more than 2.3-times larger than its GDP. In proportionate terms, US debt is less than half as much as Japan’s. The eurozone’s debt-to-GDP is a little more than 95%.
Consider fiscal policy. The cumulative budget deficit in the US for 2020 and 2021 was a stunning 26.4% of GDP. The deficit in the eurozone was less than half the size (12.2%). Japan’s was almost 16% of GDP.
Inflation seemed over-determined in the sense of being driven by several forces, including energy, supply chain disruptions, and policy. In the US, each of these sources has eased. The price of West Texas Intermediate crude oil has fallen by around 20-25% since the June peak. The average price of retail gasoline in the US has eased consistently since mid-June, and at around $3.85 a gallon, it is nearly a quarter below the high water mark. Surveys show an easing in delivery times.
The market is well aware of the Fed’s rate hikes, the promise to deliver more, and the pace of reducing the balance sheet to double to $95 bln a month starting in September. What may be less appreciated is the magnitude of the fiscal tightening. The US recorded a budget deficit of almost $58 billion in the first four months of the fiscal year. The deficit in the same 2021 period was nearly $834 bln. The median forecast in the most recent Bloomberg survey has the budget deficit falling to 4.5% of GDP this year from 10.8% in 2021. After the Global Financial Crisis, the US budget deficit peaked at 10.1% of GDP (2009), and it took four years for the deficit to fall below 5%.
Europe is less fortunate. Since the end of June, the benchmark for natural gas has risen by more than 150%. Some estimates suggest this is the equivalent of $500 a barrel for oil. It rose almost 220% in the first half. Europe continues to aid Ukraine and then feigns surprise that Russia seeks to use its energy supplies to punish it. Getting one’s head around the surge in wholesale electricity prices is challenging. In Europe, which is best understood as the cost of hedging electricity rather than consumer prices. At the end of January, the price of a kilowatt hour of electricity in one year in Germany was 145 euros. In late August, it reached 985 euros before pulling back amid talk of a new EU initiative and gas reserves filling up faster than projected. In France, during the same period, one year forward, a kilowatt hour of electricity rose from about 153 euros to 1130 euros. It, too, fell into month’s end. Many fear that Russian gas may be cut off completely, and this risk underscores the need for Europe to deliver, or prices will jump back.
EU governments have already committed around 280 bln euros to blunting the impact of higher energy on households and businesses. There are numerous national efforts, from tax cuts to heating subsidies in Poland. The Greek government plans on covering almost 95% of the increase in power bills in September. Germany has cut the VAT on gas, introduced some conservation measures, and is preparing a third package of aid. In Italy, the leaders of the two largest parties differed over the imposition of price controls, with the Meloni of the Brothers of Italy arguing in favor of the Europe-wide cap on prices. At the same time, Letta, the head of the Democrat Party, advocated a national cap. Different types of rationing regimes have also been introduced sporadically to limit heating temperature in public buildings and their use of light. The EU will hold an emergency meeting of energy ministers on September 9 in a bid to cap gas prices and/or decouple electricity and gas prices.
In late August, the UK regulator Ofgem lifted the country’s electricity and natural gas cap by 80% to GBP3,549 (~$4200) as of October 1. This is almost three times higher than last winter. This will translate into a large jump in CPI and further exacerbate the cost-of-living crisis, which is spurring widespread labor unrest. Ofgem warned that prices could rise significantly next year. The cap will be reviewed again in January (every three months now, rather than six). The Bank of England had warned that inflation would peak at 13.2% in October, but the National Institute of Economic and Social Research warns that inflation may reach 14.2% in January. Some private economists’ forecasts are above 18%. The government has already committed about GBP30 bln to help households, but that was back in May. The new UK government will be under pressure to act quickly. Truss, the likely next prime minister, has suggested boosting North Sea drilling and cutting the VAT. The aid may rival the GBP78 bln spent on the furlough and self-employed income support provided during the pandemic.
Although the eurozone’s economy expanded in the first and second quarters (0.5% and 0.6%, respectively), while the US contracted, it is seen as more vulnerable. The cost-of-living squeeze is profound. For example, the 30-year fixed rate mortgage, which is commonplace in the US, is absent from most other countries, including the eurozone and UK. This means that higher interest rates feed through to the homeowner quicker.
Leave side Covid, the commodity shock in general and the energy shock in particular, and the heightened geopolitical tension over Taiwan, China has a different level of challenge. China’s property market has been the engine of development and investment for many years. The wheels came off last year, and the consequences are still rippling through the world’s second-largest economy. China’s economic managers have neither fixed the property sector nor found an alternative engine. They risk repeating the mistakes of the US and other countries when their property market bubble popped in 2007-2008, which is to under-appreciate the magnitude.
Regulators, for example, the state-owned China Bond Insurance (CNI), have reportedly been instructed to guarantee onshore bond issues by a few private property developers. The CBI’s equity capital at the end of June was almost CNY12.5 bln (~$1.85 bln), and it is estimated that developers have more than CNY300 bln of bonds (on- and offshore) that need to be refinanced. In late August, officials announced another CNY1 trillion. Some bolder and broader initiative seems politically necessary ahead of the Party Congress in October, which will be another blow to the political reforms of Deng Xiaoping that imposed an informal two-term limit on the President and Chairman of Everything.
The extreme weather has aggravated economic challenges. In China, floods have crimped mining while droughts have cut into hydroelectric production. The rationing in some provinces may be another source of supply chain disruption. It could exacerbate the rise in food prices and inflation more generally. In Europe, the low level of the Rhine River is disrupting its use to transport goods, including coal and oil. Seasonal maintenance has curbed French nuclear output, and it finds itself in the usual situation of having to import electricity. In addition, the warm river water limits some nuclear generators’ ability to cool their plants.
In the US, while there are anecdotal reports of some water rationing, the crunch comes next year as the federal government declared a “Tier 2” crisis as of January 2023 for the Colorado River. The historic drought exacerbates the problem brewing from overuse and what some call “aridification.” The Colorado River and the country’s two largest reservoirs (Lake Mead and Lake Powell) are shared by seven states, Mexico, 22 tribal nations, and around 40 mln people. As a result, Arizona, Nevada, and Mexico will face reduced water access to the Colorado River. Arizona faces the largest cut. Starting in January, its allotment of the river water will be cut by a little more than a fifth.
Meanwhile, reports suggest that more than 20 million American households (about 1 in 6) are behind on their utility bills. During the heart of the pandemic, moratoriums were imposed on shutting off power in many states, but these have mostly been wound down. Reports suggest some power companies are getting more aggressive about cutting off services.
The combination of tighter Fed policy, a rising dollar, a weaker Chinese economy, and extreme weather have stressed many emerging market economies. Most emerging market currencies depreciated against the US dollar, and raising debt in the global capital markets has been too expensive for many. Leaving aside the Russian rouble, which is obviously in a unique situation, three of the following four best performing emerging market currencies in August were in Latin America: Peruvian sol (~2.2%), Mexican peso (~1.3%), and Chilean peso (~0.25%).
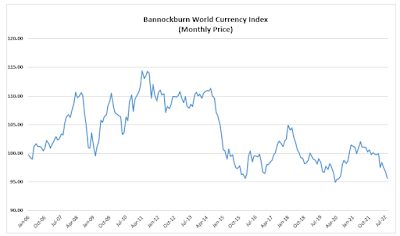
| Bannockburn’s World Currency Index, a GDP-weighted basket of the currencies from the dozen largest economies, fell by nearly 1.4% in August, reflecting the US dollar’s broad strength. That is the largest decline in four months and the second largest since March 2020. It finished August at its lowest level since May 2020 and does not appear to have bottomed. The extreme reading is consistent with other measures that show the US dollar is historically rich.
According to the OECD’s model of purchasing power parity, the euro has now eclipsed the yen as the most undervalued of the major currencies. It is nearly 42% below this metric of fair value compared with the yen’s 38.2% undershoot. Sterling is third, almost 24% undervalued. These extreme readings can be expected to distort trade, some types of capital flows, and inflation over time. |
 . |
Dollar: The dollar’s downside correction that began in mid-July ran its course by mid-August, and the underlying uptrend resumed. Even though the US economy contracted in the first two quarters, Europe seems more vulnerable. Many European currencies fell to new multiyear lows against the dollar in the second half of August. Federal Reserve Chair Powell warned that the efforts to rein in US inflation will cause some pain to households and businesses. The strength of the US labor market is the key to the central bank’s commitment to continue to raise interest rates. While weekly jobless claims have risen, the still subdued continuing claims suggest new positions have quickly been found. The recent JOLTS data on job openings surprised to the upside, and the June series was revised higher. Benchmark revisions found another 571k private sector jobs were created in the 12 months through March, about 8.5% more than previously estimated. Economists forecast the economy grew another 300k jobs in August. While below the 450k average through the first seven months of the year, it would likely be deemed sufficiently robust to allow the Fed to hike another 75 bp on September 21. The dollar’s peak may not coincide with the peak in inflation, which looked likely before, but when the labor market shows signs of cracking.
Euro: The eurozone is severely challenged. The extreme weather exacerbates the energy crisis spurred by Russia’s retaliation for Europe’s support of Ukraine. The economy was set to slow in any event as the Covid stimulus faded. There are bound to be political consequences of the cost-of-living shock rippling through Europe. Italy’s national election on September 25 will likely renew tensions with the EU over reforms necessary to free up the EU recovery funds. Although the ECB unveiled a new tool (Transmission Protection Instrument) to resist unwarranted increases in interest rate spreads, it is not clear that a right-wing government attempting to renegotiate the agreement with the EU will qualify to trigger it. The euro is vulnerable to increased tensions in the periphery. At the end of July, the swaps market had discounted about an 80% chance that the ECB would deliver another 50 bp hike at the September 8 meeting. However, the hawks have pressed their case, and the market appears to have a 75 bp hike entirely discounted and another 50 bp in October. According to the OECD’s model of Purchasing Power Parity, the euro has not been this cheap in more than 30 years. Germany’s discount on two-year borrowing has fallen to about 225 bp at the end of August from more than 275 bp at the start of the month. Despite the extreme valuation and the movement on the interest rate differential, which could spur a correction, with the Russian risk, and Italy’s election looming, we suspect the risk is still to the euro’s downside against the dollar.
(August 31 indicative closing prices, previous in parentheses)
Spot: $1.0055 ($1.0220)
Median Bloomberg One-month Forecast $1.0065 ($1.3155)
One-month forward $1.0025 ($1.0240) One-month implied vol 10.3% (10.2%)
Japanese Yen: At the risk of oversimplifying, the dollar-yen exchange rate seems to be driven by US rates. The correlation between the differences in the exchange rate and the US 2-year yield rose to a five-month high of more than 0.72 over the last 30 sessions and about 0.70 for the 10-year yield. Japanese officials are more concerned about the pace of the move than the direction or level. Moreover, the yen’s weakness seems to cause less consternation than the euro’s weakness for the ECB., perhaps reflecting the different inflation experiences. Three-month implied volatility peaked in mid-June near 14% and slipped below 10% in mid-August, finishing the most near 11%. The BOJ has not had to defend its 0.25% 10-year yield cap since June, but rising global rates may force its hand again in September. With a running start, the dollar looks poised push above JPY140 to new 24-year highs.
Spot: JPY138.90 (JPY133.25)
Median Bloomberg One-month Forecast JPY137.30 (JPY134.15)
One-month forward JPY138.55 (JPY133.00) One-month implied vol 11.1% (10.8%)
British Pound: Sterling’s 4.65% decline in August brings the year-to-date depreciation to 14.2%. Among the majors, only the Japanese yen (~-17%) and the Swedish krona (~-15.3%) have declined more. As is well known, Japan has not raised rates at all. Sweden’s Riksbank raised its repo rate by 75 bp this year (to 0.75%). The Bank of England has hiked twice as much this year (to 1.75%) and is set to lift the base rate another 50 bp in Sept. The swaps market looks for the UK policy rate to peak between 4.25%-4.50% around the middle of next year. The BOE had anticipated inflation to peak near 13.2% in October, but this seems optimistic. Private forecasts are beginning to talk about 15% or higher. Meanwhile, the UK will have its fourth prime minister in six years. Truss, the leading candidate, will inherit an economy on the verge of a five-quarter recession, forecast by the BOE, an energy crisis of historic proportions, and strike activity in numerous sectors. She is likely to respond with tax cuts and some spending increases, perhaps packed into an emergency budget before the end of the month. That policy mix of tighter monetary policy and looser fiscal policy tends to be supportive of the currency. However, we suspect sterling will first retest the 2020 Covid-spike low near $1.14. The current compromise over implementing the Northern Ireland protocol expires in mid-September. Truss threatens to invoke Article 16, allowing unilateral action and escalating tensions with the EU.
Spot: $1.1625 ($1.2170)
Median Bloomberg One-month Forecast $1.1700 ($1.21350)
One-month forward $1.1630 ($1.2180) One-month implied vol 11.8% (10.1%)
Canadian Dollar: The key driver of the Canadian dollar’s exchange rate is the general risk appetite, for which we have used the S&P 500 as a reasonable proxy. What appears to be a bear market rally in the S&P 500 from roughly mid-July to mid-August coincided with the appreciation of the Canadian dollar. The US dollar fell from near a two-year high (~CAD1.3225) on July 14 to a two-month low on August 11 (~CAD1.2730). As the S&P 500 retreated in the second half of August, the greenback recovered to challenge the CAD1.3150 area at the end of the month. The risk extends toward CAD1.3300-CAD1.3350 in the coming weeks. The Bank of Canada surprised the market with an aggressive 100 bp rate hike in mid-July, which may have helped support the Canadian dollar briefly. In the last three meetings of the year, the swaps market is pricing in 125 bp more of tightening. The next meeting is on September 7. The market toyed with the idea of another 100 bp hike but seems to have settled on 75 bp, which we think is more likely. In terms of macroeconomic data, Canada’s relative outperformance in the first half already appears to be fading. Labor market improvement is stalling, but consumption remains strong, even if shifting away from durable goods. Headline CPI softened in July for the first time since June 2021. However, the underlying measures remain firm.
Spot: CAD1.3130 (CAD 1.2795)
Median Bloomberg One-month Forecast CAD1.3070 (CAD1.2825)
One-month forward CAD1.3135 (CAD1.2800) One-month implied vol 7.7% (7.6%)
Australian Dollar: After a belated start, the Reserve Bank of Australia has aggressively tightened its monetary policy. It delivered a 25 bp hike in May to begin the cycle and made its third consecutive half-point hike in August. The futures market is pricing in a 60% chance of another 50 bp hike at the September 6 meeting. Furthermore, it is pricing in another 100 bp of tightening in Q4. There are signs that the labor market may have turned, and the interest-rate-sensitive property market has rolled over and will squeeze the indebted households. House prices have fallen 2% in the three months through July, while prices in Sydney are off 5%. Debt-to-income in Australia is at a record of more than 187%. The Australian dollar tracked the broad pattern of the US dollar. It recorded a two-year low in mid-July near $0.6680 and peaked on August 11 at almost $0.7140, just shy of the 200-day moving average (~$0.7155). It has trended lower in the last couple of weeks and appears to be on its way to retest the mid-July low (~$0.6680).
Spot: $0.6845 ($0.6985)
Median Bloomberg One-Month Forecast $0.6890 ($0.6995)
One-month forward $0.6850 ($0.6995) One-month implied vol 12.3% (12.0%)
Mexican Peso: Last month, the Mexican peso continued to perform well, but the weakness at the end of August will likely continue into the new month. The US dollar found support in the MXN19.80 area, around where it had bottomed in late June as well. A move above the MXN20.25-MXN20.27 area could signal a return to the MXN20.60, if not higher, in the coming weeks. The August high was near MXN20.8350, and the July high was slightly north of MXN21.00. The central bank delivered its second consecutive 75 bp rate hike in August to bring the target rate to 8.50%. It can be expected to match the Federal Reserve for the remainder of the year. The economy is slowing and the central bank cut its forecast for 2023 growth to 1.6% from 2.4%. The trade deficit is widening as exports fall faster than imports. Worker remittances remain high, averaging nearly $5.2 bln a month from May through July compared with $4.5 bln in the same period last year. However, the trade balance has deteriorated quicker. The average monthly shortfall in May-July was $4.0 bln compared with less than $1 bln average in the year-ago period.
Spot: MXN20.15 (MXN20.37)
Median Bloomberg One-Month Forecast MXN20.24 (MXN20.32)
One-month forward MXN20.27 (MXN20.48) One-month implied vol 12.2% (11.9%)
Chinese Yuan: Chinese officials seemed shocked by the economic weakness seen in the July reports, while the Covid-related lockdowns and energy rationing mean that the headwinds are strengthening. China has announced a lockdown of its fourth largest city at the start of September. Officials shaved key rates, announced new spending/lending efforts, and allowed the yuan to weaken against the dollar. The People’s Bank of China appears to signal that while a modest yuan depreciation is acceptable, it is not looking to repeat the six-week move through mid-May when the dollar appreciated 6.5% against the dollar. That said, we had thought that the CNY6.85 area would be sufficient, and although the dollar consolidated around there at the end of August, the risk may extend toward CNY7.0, which it has not seen since July 2020. Chinese officials are expected to provide more stimulus in Q4, including a possible cut in reserve requirements. In addition, news that an agreement that allowed US authorities to review the accounting at many Chinese companies listed on the US exchanges helped trigger a bounce in Chinese shares. Still, the underlying fundamentals are poor and ultimately could drag prices down, even with the additional fiscal and monetary support.
Spot: CNY6.89 (CNY6.7445)
Median Bloomberg One-month Forecast CNY6.8660 (CNY6.7475)
One-month forward CNY6.8930 (CNY6.7465) One-month implied vol 5.6% (5.6%)
Full story here Are you the author?Tags: Featured,macro,newsletter


