


The Lifeline of Markets- Liquidity Defined
We recently read an analogy in which the author compares the current state of asset prices to an airplane flying at 50,000 feet. Unfortunately, we cannot find the article and provide a link. The gist is market valuations are flying at an abnormally high altitude. While our market plane cannot sustain such heights in the long run, there is little reason to suspect it will fall from the sky either.
Many investors are writing on the current state of extreme equity and bond valuations. Surprisingly, there is little research focusing on what keeps valuations at such levels. Liquidity is our asset bubble’s lift and worth closely examining to better assess the markets’ potential flight path.
Market Liquidity
In the investment world, liquidity refers to the ease and cost with which financial assets can be bought and sold.
For example, U.S.
Treasury bills are highly liquid. They can change hands at a moment’s notice and usually at the prevailing market price.
Real estate is on the other side of the liquidity spectrum. Houses or land, for instance, can take months or even years to sell. The seller often reduces the asking price and/or negotiates the price lower to affect the sale. Taxes, fees, inspections, and drawn-out settlement dates further de-liquify the process.
The term liquidity applies to individual assets, as above, but can describe general market conditions as well.
Picturing Liquidity
“The market is like a large movie theatre with a small door.” Nassim Taleb
People typically enter a movie theater in a steady stream. Some arrive early, while others rush as the movie starts to find a seat. When leaving, there is an orderly exit, but it takes a little longer as everyone departs at the same time. In market parlance, we can describe the regular entrance and exit of a movie as being generally liquid.
If there is a mass urgency to get out of the theater, exiting becomes disorderly or illiquid. In the 2008 financial crisis, liquidity in many securities was scarce. Think of it as being a crowded theater when a fire breaks out. Not only was it tough to get out, but the only way to exit, or sell assets, was if someone else was willing to enter.
Liquidity Is Least Plentiful When You Need It Most
When prices rise steadily and predictably over months or years, and the ability to buy or sell an investment is both transparent and efficient, the importance of liquidity is usually taken for granted and ignored. The prices we observe on our monitors are the prices at which we can sell.
Sometimes, liquidity fades, and markets become disorderly and volatile quickly. The price at which we can sell may depart significantly from what we see on our computer screens. Such a quick change in the environment results from uncertainty and anxiety, tied to increasing volatility. Liquidity is valuable, and it comes at a dear cost in such situations.
Some say banks are always willing to lend to those who do not need money and never willing to lend to those who do.
The concept of liquidity is very similar; it is always most plentiful when you need it least and never available when you most desperately do.
The more liquid an asset or portfolio is, the easier it will be to sell or manage in a liquidity event and avoid financial distress. As such, it is worth understanding the liquidity characteristics of our holdings in both periods of excellent and poor liquidity.
For perspective on why this is so important, we study a few historically horrendous illiquid periods below.
Black Monday
From January through August 25th of 1987, the Dow Jones Industrial Average (DJIA) rose 40%. At that sharp rise higher, the market began to falter slowly. Between the peak in late August and October 16th the DJIA fell 18%.
Despite given up half of the year’s gains, few investors paid attention to two seemingly unimportant events. First, Congress was debating legislation that would tax particular merger and acquisition (M&A) activities. Second, a new investment management tool, portfolio insurance, was gaining wide popularity. Investment managers associated with M&A and portfolio insurance were adding liquidity to markets and driving prices higher, but few had given thought to how those investors might react in a market move lower.
| Concerns over proposed legislation resulted in selling by risk arbitrage desks that were speculating on M&A activity. In response, portfolio insurance strategies needed to sell. A significant source of market liquidity over the prior year was suddenly in desperate need of liquidity.
On October 19, 1987, the DJIA fell 25% on what is known as Black Monday. In just 38 calendar days, the market gave up 100% of the gains from the prior eight months. The pitfalls of portfolio insurance are often blamed for the record losses, but the real culprit was an abrupt loss of liquidity. To think, just weeks before Black Monday, markets seemed abundant with liquidity. |
Dow Jones Industrial Average, Dec 1986 - 1987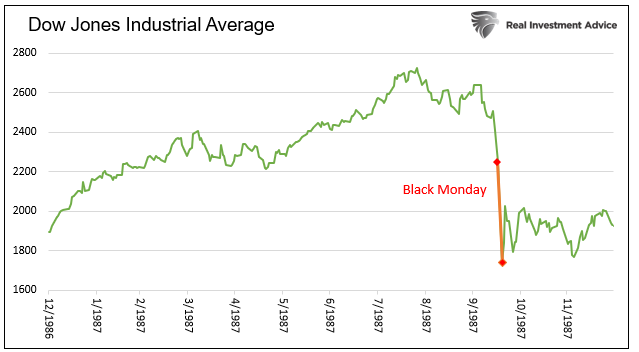 - Click to enlarge |
Sowood CapitalIn July 2007, hedge fund Sowood Capital closed its doors as they abruptly unwound a highly leveraged book of illiquid mortgages. Despite ultimately accruing $1.6 billion in fund losses, the investments were characterized by Standard & Poor’s as “neither uncommon nor excessively risky.” Instead, Sowood’s mistake was the extensive use of leverage to buy the assets. The glitch for Sowood was a lack of cash or liquid assets to post as margin when it was demanded by those lending to them. A liquidity reserve would have allowed them to post collateral and avoid selling illiquid assets into an illiquid market. Although problems for Sowood began in the spring of 2007 as the sub-prime market began to unwind, there is little sign they took steps to manage liquidity risks. Indeed, there are accounts Sowood added risky assets and further reduced liquidity in false confidence. Ultimately, the fund’s demise happened over a brief five business days ending with a 53% loss and fund closure. The biggest fault was not necessarily the investments themselves but in failing to account for a change in liquidity conditions. The 2008 Financial CrisisIn mid-2008, when Ben Bernanke was still unaware of an economic recession and downplaying the effects of the sub-prime mortgage market, markets were becoming increasingly erratic. Market stability following the March 2008 Bear Stearns/JP Morgan bailout was a short-lived façade of calm. Chaos erupted in August when Fannie Mae and Freddie Mac, which together held $1.2 trillion of primarily high-quality liquid mortgages on a heavily leveraged basis, were forced to recognize deterioration in the value of their assets. Because of the combination of excessive leverage and eroding liquidity, they desperately raised money to shore up their capital. Most of this came from the government (taxpayer) as they were placed into conservatorship by their regulator. Other leveraged holders of mortgage-related bonds, such as the world’s largest banks and several international insurance companies, came under similar duress. From August 2008 to March 2009, the threat of bank and corporate defaults grew as asset real estate values continued to fall. Those events created an erosion of trust among and between banks and investors. Liquidity was hard to find in almost all asset markets. During the crisis, liquidity holes were commonplace, even in the most liquid and least risky assets. In a unique aberration, some high-quality assets fell more in price than lower-quality assets as investors sold anything with a bid. Uncertainty and loss of liquidity became so problematic that many risky asset markets became structurally closed. No bid existed for sellers to entertain. Those in distress had no option but to sell higher-quality assets aggressively and indiscriminately. The need to deleverage and raise cash superseded all else. |
|
Extreme LiquiditySince the financial crisis, the Fed and most other central bankers have taken unprecedented steps to keep interest rates at multi-century lows. Further, they bolster their balance sheets via QE, thereby delivering direct and indirect amounts of excessive liquidity into the markets. The graph below, courtesy of Lohman Econometrics, shows the correlation between asset values and central bank assets. |
Major Central Bank Assets vs Global Stock and Bond Market Value, 2009 - 2021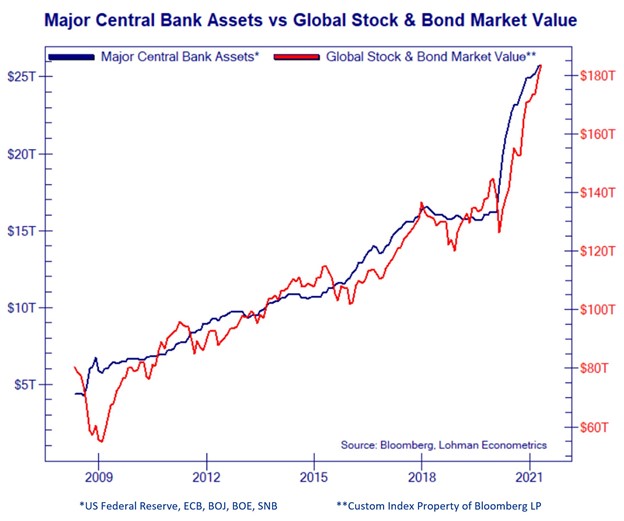 - Click to enlarge |
| Not only is the Fed providing massive amounts of liquidity, but it spurs investors to use margin debt. This process creates even more liquidity.
The graph below shows how margin debt benefits markets to the upside, but its removal results in sharp downturns. The second graph shows the current use of margin debt, as a percentage of the economy, is at 60-year highs. |
Margin Data, 1997 - April 2021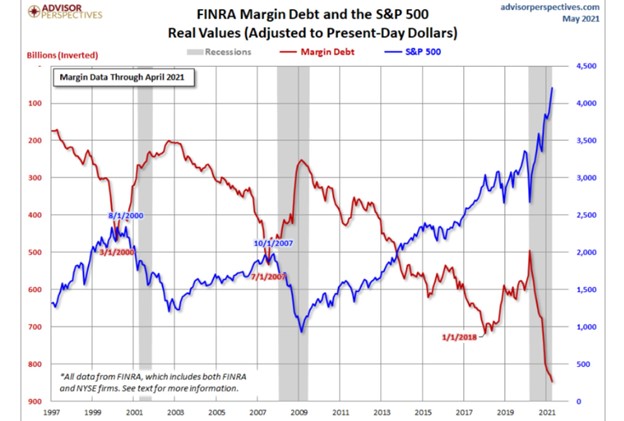 - Click to enlarge |
| With an understanding of the three historical examples, investors should be asking what if the liquidity lift keeping our market plane aloft gives out. More directly, what if the Fed were to reduce liquidity or, worse, was suddenly unable to provide liquidity? An inflationary outbreak or a disorderly drop in the U.S. dollar are two such air pockets that could develop rather quickly. Many others are not so obvious. |
Margin Debt / Nominal GDP, 1959 - 2021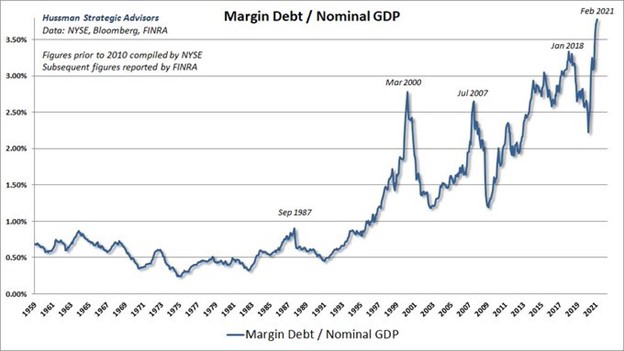 - Click to enlarge |
Summary
When we are healthy, we rarely think about the air we breathe or the water we drink despite their overwhelming importance to normal body functioning. In much the same way, investors and the media casually toss around the word “liquidity” yet fail to grasp its significance.
As we see today, extremes in tranquility are seen as an “all clear.” In reality, they are future warnings. The examples we provide, and many others, stress that the time for understanding, tracking, and bolstering liquidity is precisely when it is most available, and everyone else takes it for granted.
We are not predicting an imminent fire in the market’s movie theater or our valuation plane to suddenly plunge 30,000 feet. We are, however, reminding you such events are not infrequent, and given the current environment it is best to have a plan in place for such a liquidity event.
The post The Lifeline of Markets – Liquidity Defined appeared first on RIA.
Full story here Are you the author?
Tags: Featured,Investing,newsletter


