| The months of November and December aren’t always easily comparable year to year when it comes to American shopping habits. For a retailer, these are the big ones. The Christmas shopping season and the amount of spending which takes place during it makes or breaks the typical year (though last year, there was that whole thing in March and April which has had a say in each’s final annual condition).
The calendar being what it is – we’ve never been forced to use the French Revolutionary datebook, thankfully, not yet – there are quirks. Pertaining to US retail sales, the Census Bureau, the government’s agency given the task of keeping track, it really comes down to the number of weekends each way. That final one in November one year could be the first one for December the following year. This can lead to unusually large discrepancies between unadjusted data and seasonally-adjusted estimates. The latter attempt to make for, in Christmas shopping terms, homogenized calendars – without all the fuss and bother of running amok Jacobins. |
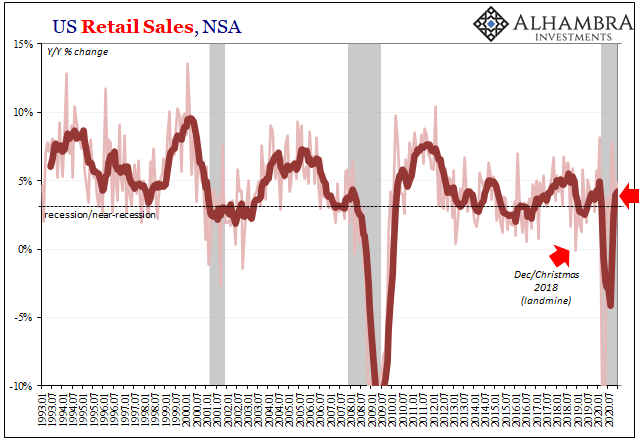
U.S. Retail Sales, NSA, Jan 1993 - Jul 2020 |
| With the in-between weekend ending up in December 2020 where it had been included in November 2019, the sales figures skew accordingly. The Census Bureau tells us that, unadjusted, November seemed low and December appeared better (revised 2.00% year-over-year and 4.85%, respectively).Seasonally-adjusted, neither was particularly good (3.74% and 2.94%, respectively). And if you combine November and December 2020’s unadjusted together, on a holiday basis the two months together were just 3.5% above the same pair in 2019.
Or was that awesome? It’s hard to tell because of the circumstances surrounding last year and its massive economic recession. In any other year, growth rates for holiday shopping down around 3% is cause for recessionary concerns. However, could it be a minor miracle that retail sales are positive at all? The government would surely like to believe so because, given the employment situation, that Christmas wasn’t a complete wipeout seems like a win for Treasury (the Fed would like to jump on this, too, but any idea of QE’s “V” is long forgotten now). |
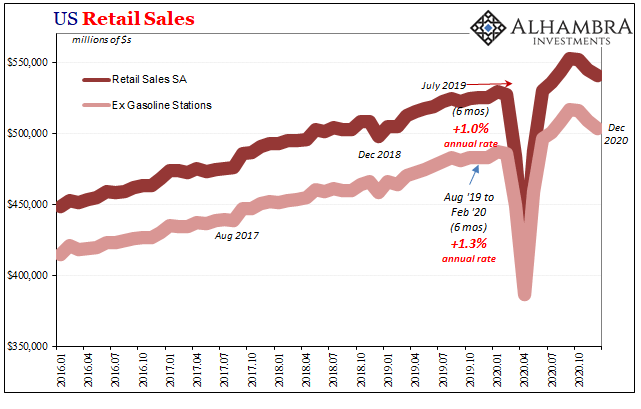
U.S. Retail Sales, Jan 2016 - Dec 2020 |
| However, concerns rise here, too, given that on a monthly basis retail sales had declined in each of the three months of Q4. |
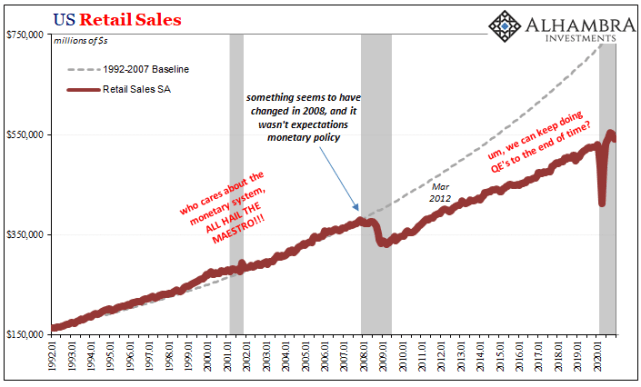
U.S. Retail Sales, Jan 1992 - 2020 |
| Like the labor market, consumer spending ended 2020 going in the wrong direction. Therefore, what had been motivated “stimulus” indifference has been transformed into urgency.
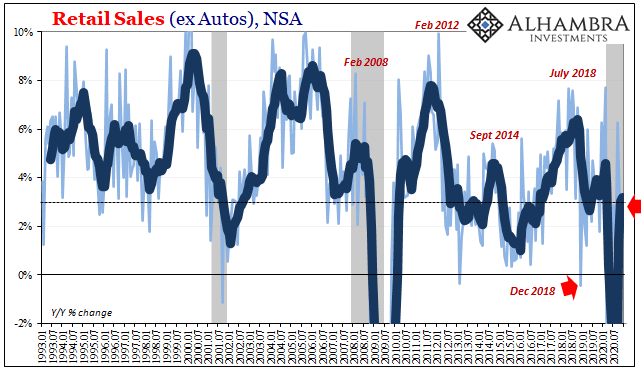
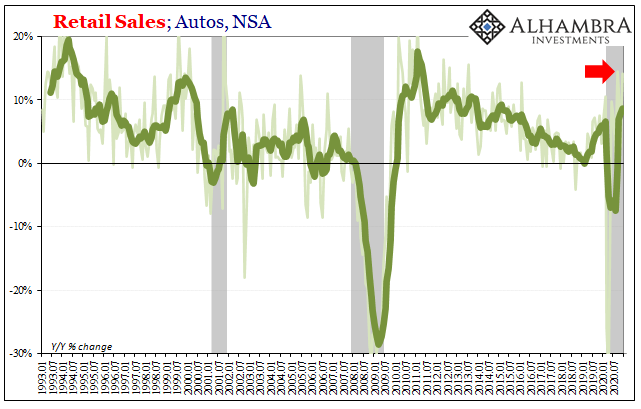
It’s also difficult to say just how urgent government aid and stipends really need to be coming from the consumer spending data. This thing about auto sales that we’ve been documenting for months has reached an untenable point; Census says auto sales are practically booming, but practically no one else agrees. In the retail sales numbers, auto sales leaped by 14% year-over-year, and not for the first time of late. |
U.S. Retail Sales ex Autos, Jan 1993 - Dec 2020 |
| What that means for overall retail, if you take autos out, the combined holiday period goes from 3.5% (noted above) down to just 2.5%. That’s how much of a positive contribution this apparent splurging may have made. |
U.S. Retail Sales Autos, Jan 1993 - Dec 2020 |
Motor Vehicle Sales & Production, Jan 2016 - Dec 2020 |
|
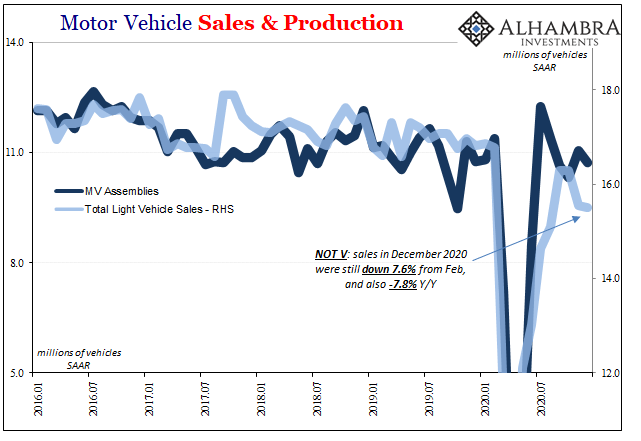
| However, if you go to the BEA’s estimates for light vehicle sales (which only tallies the number of units, unlike retail auto sales which tries to figure the total dollar value of everything sold) the auto sector is going in the clear opposite direction. In this series, the number of units moved in November 2020 was around 15.6 million (SAAR), or 8.4% fewer than during November 2019. Estimates for December 2020 (not released yet) are a little lower still, 15.5 million, which would be 7.8% less than December 2019.
Auto sales up 14%, or down 8%? According to another data source, the Federal Reserve, domestic auto production seems to be corresponding with the -8%. |
Motor Vehicle Sales & Production, Jan 2005 - Dec 2020 |
| In its Industrial Production series, the number of Motor Vehicle Assemblies (MVAS) in December was just 10.7 million (SAAR). Prior to this year, there had only been 7 months since the start of 2014 when output had been less than 10.75 million.
In other words, presumed production of cars and light trucks continues to move along at an unusually low level even though automakers in the US (according to the IP figures) and around the world (using other data) basically shut down production earlier in 2020 for the equivalent of almost three full months (half levels in March, near 100% in April, only slightly more in May, and then a little better than half in June). |
U.S. Industrial Production, Jan 2016 - Dec 2020 |
| Why aren’t carmakers producing at full speed and then some to make up for nearly a quarter-year of lost output? If the Census Bureau’s numbers are accurate, you’d think they’d be running three full shifts night and day to catch back up.
The discrepancy isn’t used cars, either. Though sales at used car dealers (included in the Census Bureau estimates) are up, too, they only make up about 1/9th to 1/10th of retail auto sales. It raises questions about data sources and integrity which quite naturally might arise given the ongoing situation. If auto sales are so far out of line – too high and too deferential to anticipated “stimulus” effects – in Census, might other data be the same even if not quite to this same level of difference? |
U.S. Industrial Production, SA, Jan 2011 - 2020 |
| Redbook index estimates, for example, have been running substantially less on average than rates put up pre-COVID. |
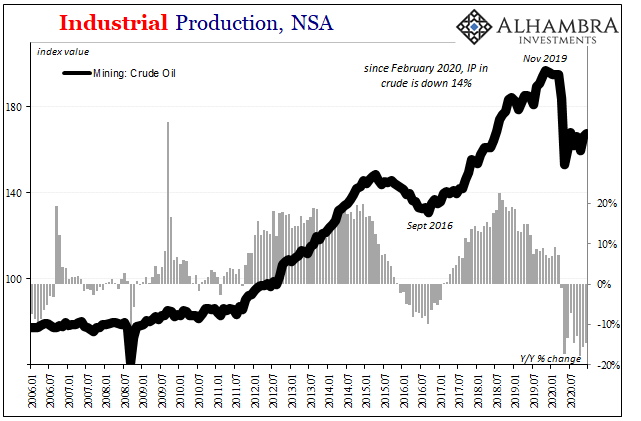
U.S. Industrial Production, Mining Crude, Jan 2006 - 2021 |
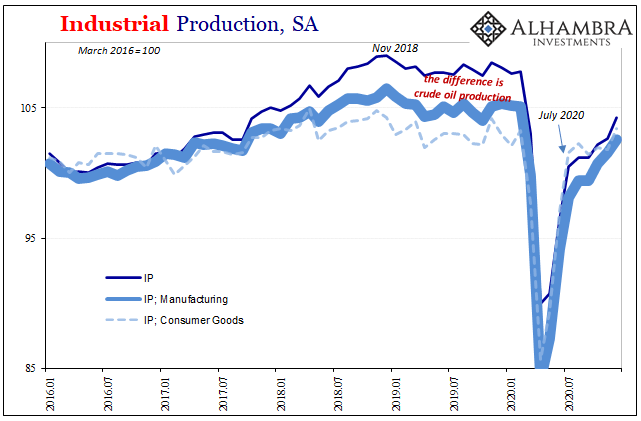
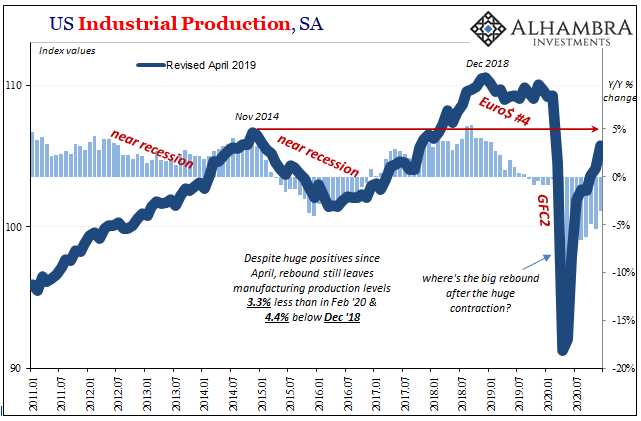
| That’s really what the entire IP estimates suggest. Not just in autos, but across-the-board American industrial output lags these spending figures to a substantial extent. Even though the Fed figures IP rose at a noticeably better rate in December (seasonally-adjusted when compared to November), overall total production remains down more than 3% compared to February and more than 4% compared to the prior peak which dates all the way back to the end of 2018.
That’s less output than November 2014. Forget any ideas about a labor bottleneck. |
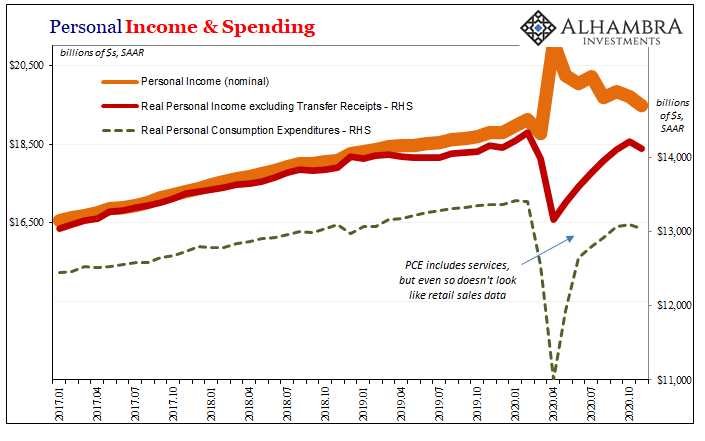
Personal Income & Spending, Jan 2017 - 2020 |
If this is so, and the labor data sure looks like it, then it should be a factor to consider when thinking about what comes next and what 2021 ends up looking like. Vaccines, sure, but what else? Even though bond yields are up when compared to November and the lows in August, why aren’t they up more considering the supposed inflationary “consensus” gripping other asset classes?
Retail sales and especially autos only got halfway to a “V.” From these other data sources, the economy’s not even close to halfway having reached last year’s very, very welcome finish. The amount of lost activity throughout the majority of 2020, right up into December, it’s hard to believe that won’t matter; or if it does end up being a problem, Uncle Sam’s checks will, unlike Japan’s, render any longer run damage and consequences inconsequential. |
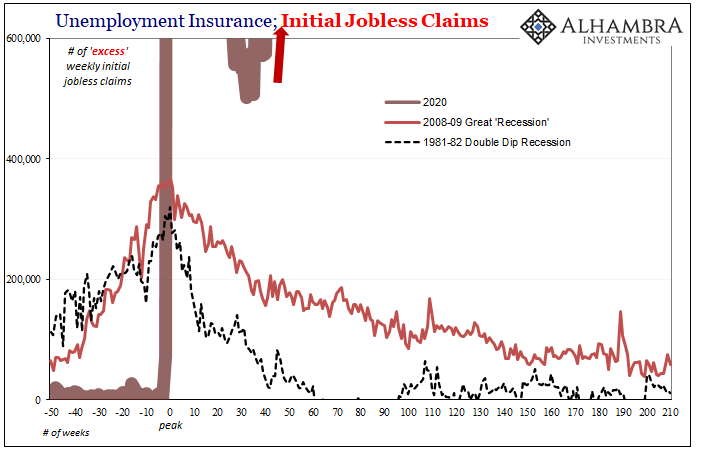
U.S. Unemployment Insurance; Initial Jobless Claims |
Full story here Are you the author? Previous post See more for Next post
Tags: Auto Sales,Bonds,consumer spending,currencies,economy,employment,Featured,Federal Reserve/Monetary Policy,industrial production,Markets,Motor Vehicle Assemblies,newsletter,Retail sales,Unemployment


