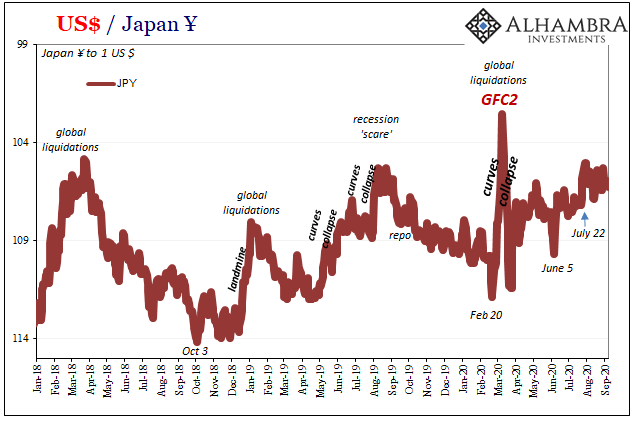
| Japan’s yen is backward, at least so far as its trading direction may be concerned. This is all the more confusing especially over the past few months when this rising yen has actually been aiding the dollar crash narrative while in reality moving the opposite way from how the dollar system would be behaving if it was really happening.
A dollar crash, or even just a true reflationary dollar drop, would be JPY negative (like 2017). Ever since the last one, during Euro$ #4, the trend for Japan’s currency is toward the worrisome side, all the illiquidity and shortage stuff what leads the dollar to rise against everyone else. |
US / Japan, 2018-2020 |
| The simple truth is that rising yen is bad. You need look no further than the history of the past few years suffering the increasing burden of Euro$ #4. JPY’s signal may have faded a bit from the middle part of the last decade, but it still contains a lot of relevant information and details about what we want to know. |
NYMEX WTI Futures, 2018-2020 |
| So, you’ll notice that since GFC2 and the massive monetary “flood” we keep hearing about, the direction JPY has taken contradicts that view. Certainly not dollar crash, for the most part. And while that has, again, added to the euro’s pull in making it seem like the dollar was going down (how it affects DXY, in particular), underlying this contrary move in the yen must instead be all the bad stuff consistent with an ongoing global dollar shortage which makes up the more general rising dollar behavior.
And it only gets worse, or at least the upward move which corroborates the concerns being likewise traded in bonds and now oil. Notice also which two dates stick out on the JPY chart over the last few months. First, once more, June 5 shows up yet again as peak reflation. Then, perhaps more importantly, mid-July, the week of July 25, when the yen takes another leg higher – meaning caution against everything from dollar crash to generalized dollar liquidity/abundance. |
Dollar Correlations, 2020 |
| These are not the signals you want to see if you’re Jay Powell with mid-September now looming. It isn’t the worst case, either, more of a broad, non-specific sense of foreboding rather than anything which makes something awful seem imminent; slanted in the wrong direction, sure, rather than crashing headlong into the calendar bottleneck point.
One more thing; mid-July also shows up in credit spreads in pretty much that same way. Spreads have been improving, but they remain unusually elevated particularly given all the presumed “support” for these markets (and liquidity overall) extended by the Federal Reserve. The central bank has worked into overdrive in its real toolkit (the financial media) pushing the inflation idea despite it being rejected in widespread fashion. |
Credit Spreads, 2017-2020 |
| Not only are spreads about as high right now as they were during the worst of 2018’s pretty shocking and disruptive landmine, they stopped improving right around…July 22. Like June 5, that’s also a date which seems to be repeated for all the wrong reasons (no “V”). |
Credit Spreads, 2020 |
| In other words, from JPY to WTI to credit spreads and bond yields, there’s quite a lot not to like about how everything was positioned and moving as August turned into September. So, is that a good sign that it hasn’t been worse with one week left to go before the underlying ebb in liquidity? Or foreboding with some things now more actively moving the wrong way (including stocks)?
JPY and T-bills, the repo twins, those will tell the story over the next week. And, of course, well beyond it. |
Personal Claiming UI Benefits, 2020 |
Full story here Are you the author? Previous post See more for Next post
Tags: $JPY,Bonds,credit spreads,currencies,dollar,economy,eurodollar system,Featured,Federal Reserve/Monetary Policy,global dollar shortage,Japan,Japanese yen,Markets,newsletter,OIL,WTI,wti futures curve,Yen


