


Lance Roberts
My articles My offerMy siteAbout meMy videosMy books
Follow on:TwitterSeeking AlphaFacebookAmazon
| As discussed in Is It Insanely Stupid To Chase Stocks, the market has gotten quite ahead of the fundamentals as money continues to chase performance. In the Q2-2020 review of Commitment Of Traders report (COT,) we can see how positioning has moved back to extremes.
The market remains in a bullish trend from the market lows but is very overbought short-term. Despite valuations reaching more extreme levels, economic growth very weak, and a risk of a reduction in stimulus; investors continue to chase markets. While the S&P 500 is primarily driven higher by the largest 5-market capitalization companies, it is the Nasdaq that has now reached a more extreme deviation from its longer-term moving average. Moving averages, especially longer-term ones, are like gravity. The further prices become deviated from long-term averages, the greater the “gravitational pull” becomes. An “average” requires prices to trade above and below the “average” level. The risk of a reversion grows with the size of the deviation. The Nasdaq currently trades more than 23% above its 200-dma. The last time such a deviation existed was in February of this year. The Nasdaq also trades 3-standard deviations above the 200-dma, which is another extreme indication. Such does not mean the market is about to crash. However, it does suggest the “rubber band” is stretched so tightly any minor disappointment could lead to a contraction in prices. But it isn’t just the more extreme advance of the market over the past 8-weeks which has us a bit concerned in the short-term, but a series of other indications which typically suggest short- to intermediate-terms corrections in the market. |
QQQ - Invesco QQQ Trust - Click to enlarge |
The “Greed” FactorMarket sentiment is back to more “extreme greed” levels. Unlike a pure “sentiment” based indicator, this gauge is a view of what investors are doing, versus what they are “feeling.” |
Market Greed/Fear Index, 2006-2020 - Click to enlarge |
| The rapid acceleration in price has sent our technical composite gauge back towards extreme overbought levels as well. (Get this chart every week at RIAPRO.NET)
What we know is that markets move based on sentiment and positioning. Such makes sense considering that prices are affected by buyers and sellers’ actions at any given time. Most importantly, when prices, or positioning, become too “one-sided,” a reversion always occurs. As Bob Farrell’s Rule #9 states:
So, how are traders positioning themselves currently? |
Technical Overbought/Sold Composite, 1998-2020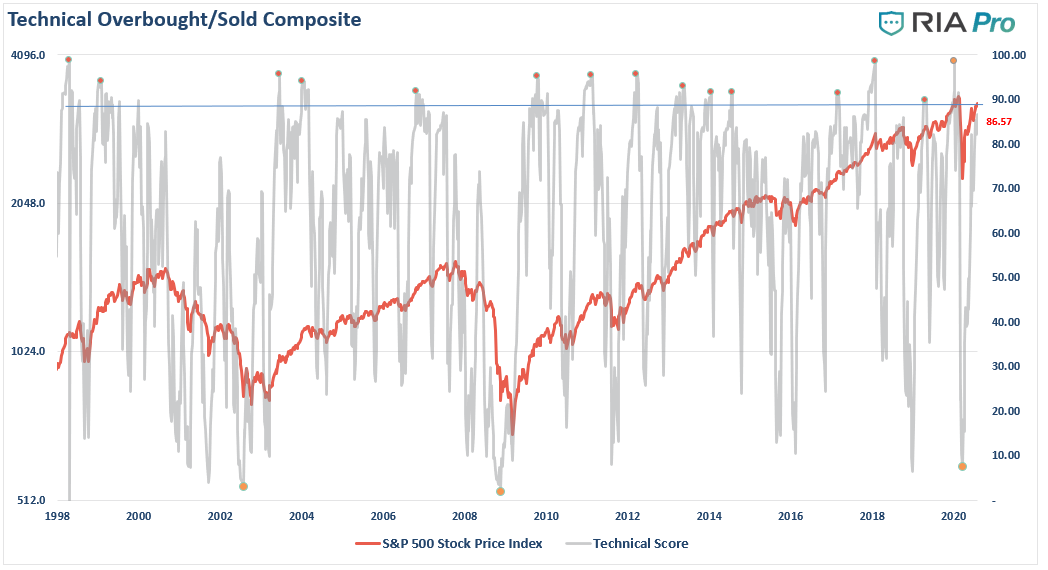 - Click to enlarge |
Positioning ReviewThe COT (Commitment Of Traders) data, which is exceptionally important, is the sole source of the actual holdings of the three key commodity-trading groups, namely:
The data we are interested in is the second group of Non-Commercial Traders. This is the group that speculates on where they believe the market is headed. While you would expect these individuals to be “smarter” than retail investors, we find they are just as subject to “human fallacy” and “herd mentality” as everyone else. Therefore, as shown in the charts below, we can look at their current net positioning (long contracts minus short contracts) to gauge excessive bullishness or bearishness. VolatilityThe extreme net-short positioning against the volatility index was an excellent indicator of the February peak. The sharp sell-off in March, not surprisingly, sharply reduced the short-positions outstanding. With the markets continuing to rally from the March lows, investors are again becoming encouraged to take on risk. Currently, net shorts on the VIX are rising sharply and are back to more extreme levels. While not as severe as seen in 2017 or 2020, the positioning is large enough to fuel a more significant correction. The only question is the catalyst. Investors have gotten used to extremely low levels of volatility, which is unique to this market cycle. Due to low volatility, the complacency has encouraged investors to take on greater levels of risk than they currently realize. When volatility eventually makes it return, as we saw in March, the consequences will not be kind. |
VIX Non-Commercial Net Positioning, 2004-2020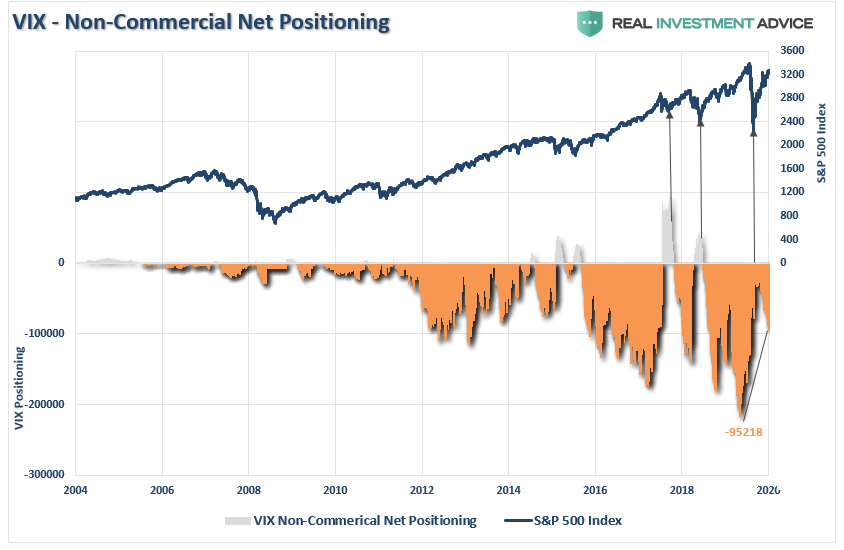 - Click to enlarge |
Crude Oil ExtremeThe recent attempt by crude oil to get back above the 200-dma coincided with the Fed’s initiation of QE-4. Historically, these liquidity programs tend to benefit highly speculative positions like commodities, as liquidity seeks the highest rate of return. While prices collapsed along with the economy in March, there has been a sharp reversion on expectations for a global economic recovery. Interestingly, with the economic recovery showing signs of slowing, crude oil has stalled below its 200-dma. As we discussed recently with our RIAPRO subscribers: |
Light Crude Oil, 2018-2020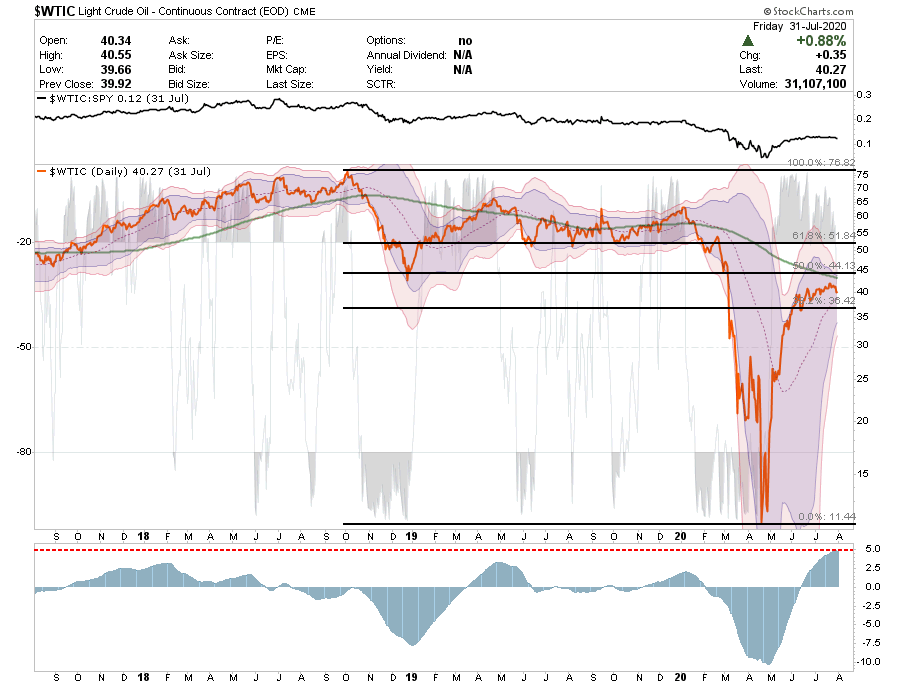 - Click to enlarge |
Despite the decline in oil prices earlier this year, it is worth noting crude oil positioning is still on the bullish side with 543,826 net long contracts. While not the highest level on record, it is definitely on the “extremely bullish” side. |
Crude Oil Net Positioning, 2000-2020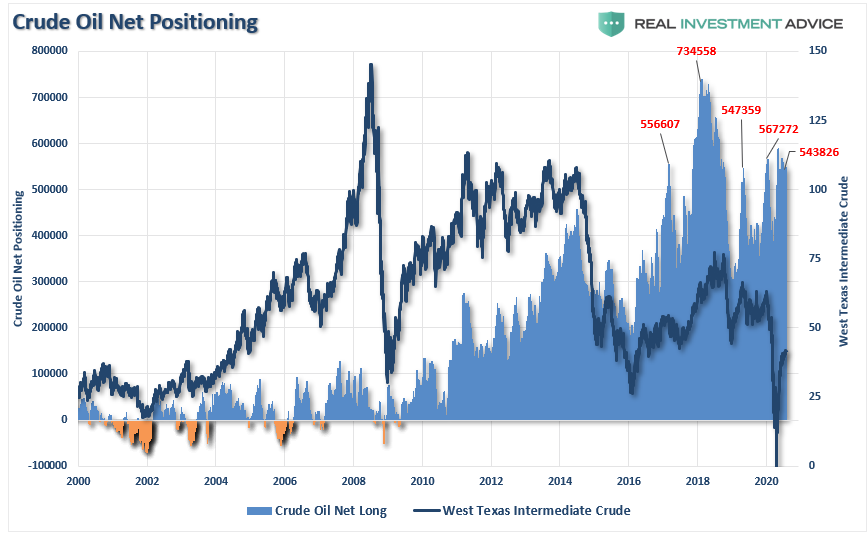 - Click to enlarge |
Oil Leads Stocks & The EconomyImportantly, there is a decent correlation to the rise, and fall, of oil prices and the S&P 500 index. If oil begins to correct again, it will be in conjunction with an economic downturn. Stocks will follow suit. As we wrote back in February:
The rest, as they say, is history. |
Crude Oil Net Positioning, 1986-2020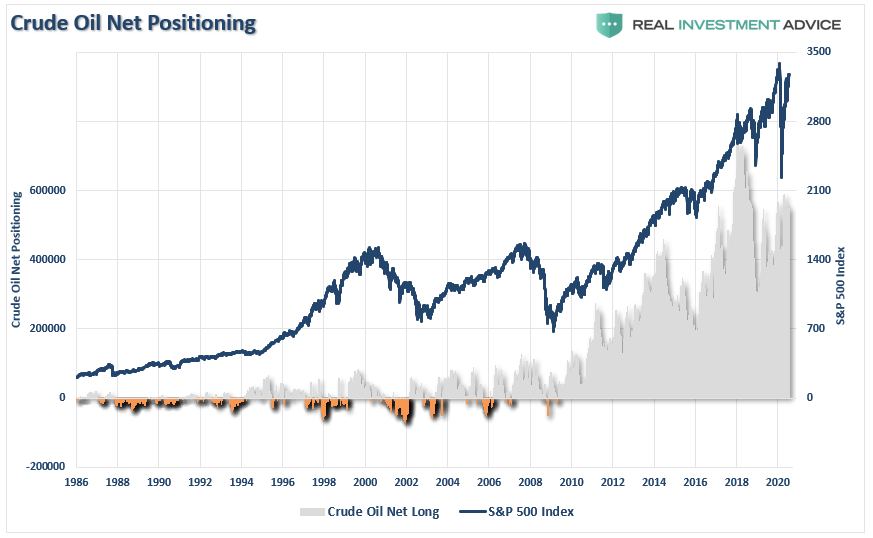 - Click to enlarge |
U.S. Dollar ExtremeAnother index we track each week at RIAPRO.NET is the U.S. Dollar.
|
US Dollar Index, 2016-2020 - Click to enlarge |
Much of the bulls rallying cry has been based on the dollar weakening with the onset of QE. However, over the last couple of months, the long-dollar bias has reverted to a net “short” positioning. Historically, these reversals are markers of more important peaks in the market, and subsequent corrections. |
USD Non-Commercial Net Positioning, 2000-2020 - Click to enlarge |
Interest Rate ExtremeOne of the biggest conundrums for the financial market “experts” is why interest rates fail to rise. In March of last year, I wrote “The Bond Bull Market” which was a follow up to our earlier call for a sharp drop in rates as the economy slowed. We based that call on the extreme “net-short positioning” in bonds which suggested a counter-trend rally was likely. Since then, rates fell to the lowest levels in history as economic growth collapsed. Importantly, while the Federal Reserve turned back on the “liquidity pumps” in March, juicing markets back toward all-time highs, bonds have continued to attract money for “safety” over “risk.” Not surprisingly, despite much commentary to the contrary, the number of contracts “net-short” the 10-year Treasury, while reduced, remains at levels that have preceded further declines in rates. Such suggests we are “not out of the woods” yet, economically speaking. |
10-Yr Treasury Non-Commercial Net Positioning, 2000-2020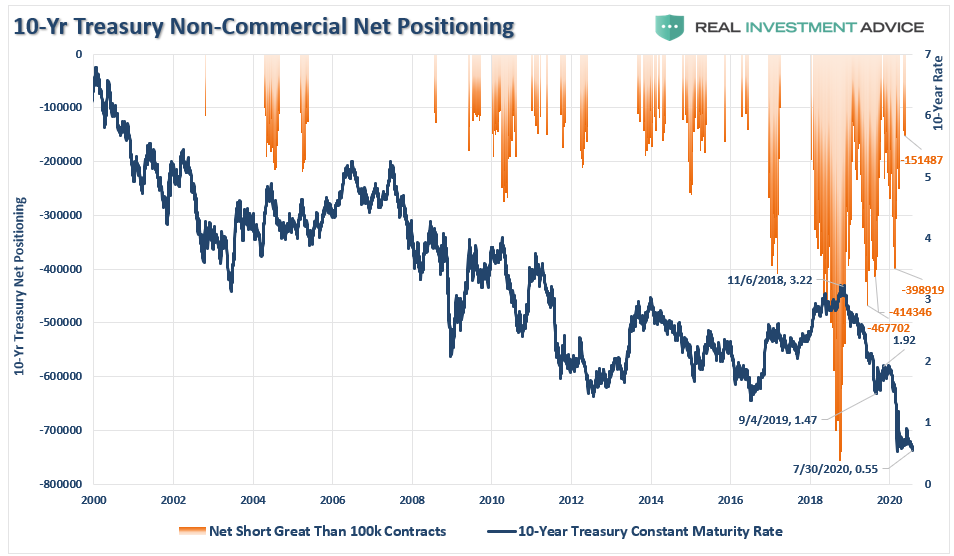 - Click to enlarge |
| Importantly, even while the “net-short” positioning in bonds has reversed, rates have failed to rise correspondingly. The reason for this is due to rising levels of Eurodollar positioning. Such is due to foreign banks pushing reserves into U.S. Treasuries for “safety” and “yield.” |
10-Yr Treasury vs EuroDollar Non-Commercial Net Positioning, 1997-2019 - Click to enlarge |
Conclusion
Amazingly, investors seem to be residing in a world without any perceived risks and a strong belief that financial markets can only rise further. The arguments supporting those beliefs are based on comparisons to previous peak market cycles. Unfortunately, investors tend to be wrong at market peaks and bottoms.
With retail positioning very long-biased, the implementation of QE-4 has once again removed all “fears” of a correction, recession, or bear market. Historically, such sentiment excesses form around short-term market peaks.
Such is a excellent time to remind you of the other famous “Bob Farrell Rule” to remember:
“#5 – The public buys the most at the top and the least at the bottom.”
What investors miss is that while a warning doesn’t immediately translate into a negative consequence, such doesn’t mean you should not pay attention to it.
As I concluded in our recent newsletter:
“There remains an ongoing bullish bias that continues to support the market near-term. Bull markets built on ‘momentum’ are very hard to kill. Warning signs can last longer than logic would predict. The risk comes when investors begin to ‘discount’ the warnings and assume they are wrong.
It is usually just about then the inevitable correction occurs. Such is the inherent risk of ignoring risk.’”
The cost of not paying attention to risk can be extraordinarily high.
The post Technically Speaking: COT Positioning – Back To Extremes: Q2-2020 appeared first on RIA.
Full story here Are you the author?Tags: Featured,Investing,newsletter


