George Dorgan
My articles My siteAbout meMy videosMy books
Follow on:LinkedINTwitterSeeking Alpha
CFA SocietyEconomicBlogs
We do not like Purchasing Power or Real Effective Exchange Rate (REER) as measurement for currencies. For us, the trade balance decides if a currency is overvalued. Only the trade balance can express productivity gains, while the REER assumes constant productivity in comparison to trade partners.
Who has read Michael Pettis, knows that a rising trade surplus may also be caused by a higher savings rate while the trade partners decided to spend more. This is partially true. Recently Europeans started to increase their savings rate, while Americans reduced it. This has led to a rising trade and current surplus for the Europeans. But also to a massive Swiss trade surplus with the United States, that lifted Switzerland on the U.S. currency manipulation watch list.
To control the trade balance against this “savings effect”, economists may look at imports. When imports are rising at the same pace as GDP or consumption, then there is no such “savings effect”.
After the record trade surpluses, the Swiss economy may have turned around: consumption and imports are finally rising more than in 2015 and early 2016. In March the trade surplus got bigger again, still shy of the records in 2016.
Swiss National Bank wants to keep non-profitable sectors alive
Swiss exports are moving more and more toward higher value sectors: away from watches, jewelry and manufacturing towards chemicals and pharmaceuticals. With currency interventions, the SNB is trying to keep sectors alive, that would not survive without interventions.
At the same time, importers keep the currency gains of imported goods and return little to the consumer. This tendency is accentuated by the SNB, that makes the franc weaker.
Texts and Charts from the Swiss customs data release (translated from French).
| Swiss foreign trade recorded a record decline in the second quarter of 2020. In seasonally adjusted terms, exports plunged by 11.5% compared to the previous quarter and imports even by 16.0%. This result stems from the traffic collapse recorded in April in the wake of the coronavirus pandemic, with May and June having regained some color. The trade balance closed with a record surplus of 9.6 billion francs.
In short ▼ Jewelery and jewelry: -70.2% for exports and -80.6% for imports ▼ Watch exports: halved and return to their level of the second quarter of 1999 ▼ A fifth drop in exports to North America ▲ China: increase in both directions of traffic and record imports |
Swiss exports and imports, seasonally adjusted (in bn CHF), Q2 2020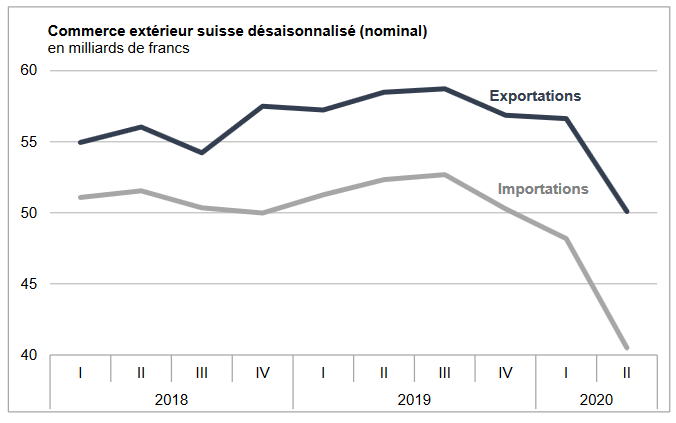 - Click to enlarge |
Global evolutionIn the second quarter of 2020, seasonally adjusted exports recorded a historic decline of 11.5% (actual: -12.5%). They therefore fell to 50.1 billion francs, their lowest level since the last quarter of 2016. On a monthly basis, outflows suffered particularly in April before rebounding in June. With -16.0% (actual: -12.1%), imports had not declined as much over a quarter in decades to stand at 40.5 billion francs. The intra-quarterly trend shows, after the fall in April, a clear recovery in May and June. The trade surplus stood at 9.6 billion francs. |
Switzerland Trade Balance, June 2020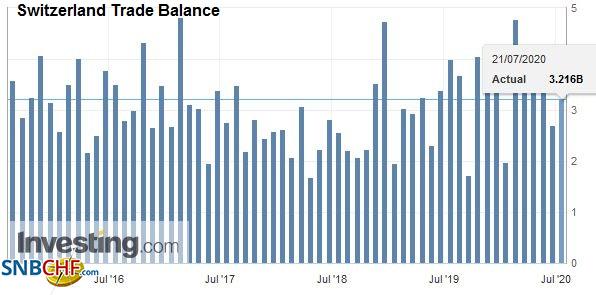 Source: investing.com - Click to enlarge |
Exports: general decline in all sectors
|
Swiss Exports per Sector Q2 2020 vs. 2019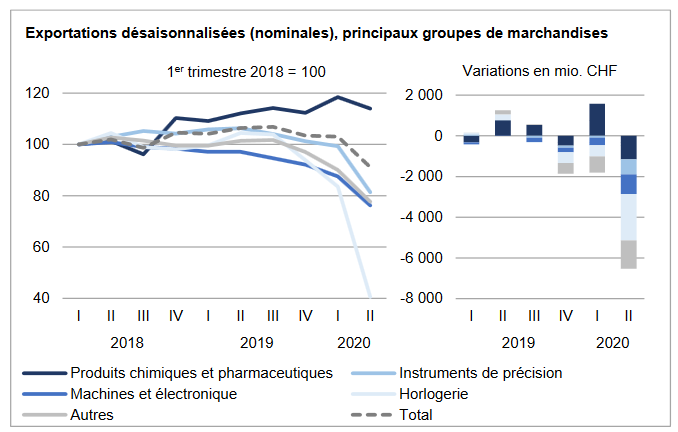 - Click to enlarge |
-40% for imports of French originAs a whole, imports lost 16.0% or 7.7 billion francs in a quarter. With the exception of the textiles, clothing and footwear group, whose imports peaked at a record level of 3.2 billion francs, all segments posted a decline. The latter nonetheless concentrated 70% on three groups: jewelry and jewelry (- 80.6% or -2.8 billion francs; other goods heading), vehicles (passenger cars: -43, 7% or -1.0 billion) as well as chemical and pharmaceutical products (-1.2 billion). For passenger cars, admissions were even at a lower level since 1998. For their part, the machinery and electronics segment (- 506 million) as well as metals (-457 million) also evolved negatively. In the second quarter of 2020, the three main sources of supply were down sharply. Europea recorded a fifth consecutive quarter in decline (-17.8%), weighed down by partners German (-2.0 billion francs), French (-1.6 billion), Italian (- 693 million) and Austrian (-339 million). Imports also nosedived from North America (-23.4%; USA: -653 million), while those from Asia were down 4.3%. The Asian result is mainly explained by the United Arab Emirates (-816 million; jewelry and jewelry) and Hong Kong (-385 million). Conversely, China (+839 million) and Singapore (+140 million) advanced, the former even reaching a record level of 4.5 billion francs. |
Swiss Imports per Sector Q2 2020 vs. 2019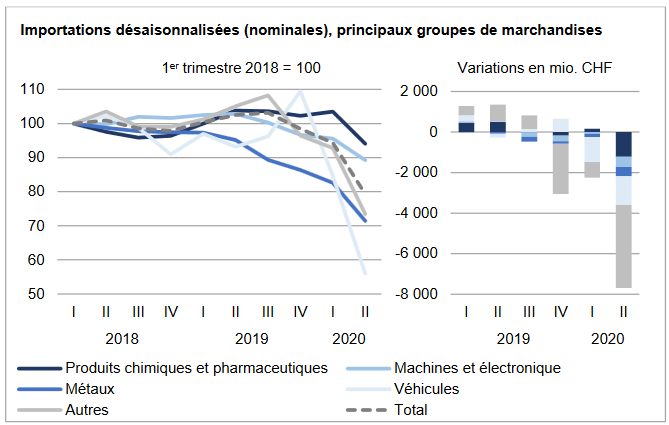 - Click to enlarge |
Tags: Featured,newsletter,Switzerland Exports,Switzerland Exports by Sector,Switzerland Imports,Switzerland Imports by Sector,Switzerland Trade Balance