


Jeffrey P. Snider
My articles My offerMy siteAbout meMy videosMy books
Follow on:LinkedINTwitterSeeking Alpha
|
These are not numbers that are consistent with a robust rebound. In fact, they don’t indicate very much of one at all. IHS Markit’s flash PMI’s for July 2020 instead look way too much like the sentiment indicators in Germany and Japan. Though they are now back near 50, both services and manufacturing, that doesn’t actually indicate what everyone seems to think it does. For July, the headline manufacturing index came in at 51.3, up from 49.8 in June. The service index was still less than 50, just 49.6, putting the composite number at 50 exactly. After an enormous downside, how would a “V” sort of rebound appear in PMI terms? To borrow an ill-served phrase used by the Fed, the PMI would be symmetric. A rebound shows up kind of like this: |
IHS Markit US Composite, 2018-2020 - Click to enlarge |
| The farther down it goes, the farther up to balance it indicating a bottom has been reached and the other side well underway. That’s not what these PMI’s are suggesting, however, as both manufacturing and services are stuck nearer the 50 range.
While that certainly looks like a “V” on the chart, getting back to 50 after an extreme fall actually means only half the imagined “V” has been completed – we’ve reached the bottom and economic conditions are stabilizing around that trough. But we don’t want to stabilize around the trough, we need to be robustly moving higher away from the floor. |
IHS Markit US Composite, 2018-2020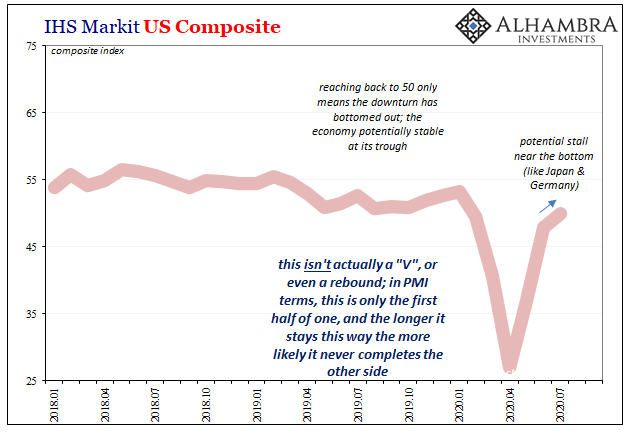 - Click to enlarge |
| In actuality, Markit’s PMI numbers posted on the chart immediately below depict and correspond almost exactly to the data further below for Japan and Germany, as well as the production levels indicated by US IP. Stall, in other words, while still closer to that bottom before the rebound has really gotten started. |
Global PMIs & Sentiment, 2017-2020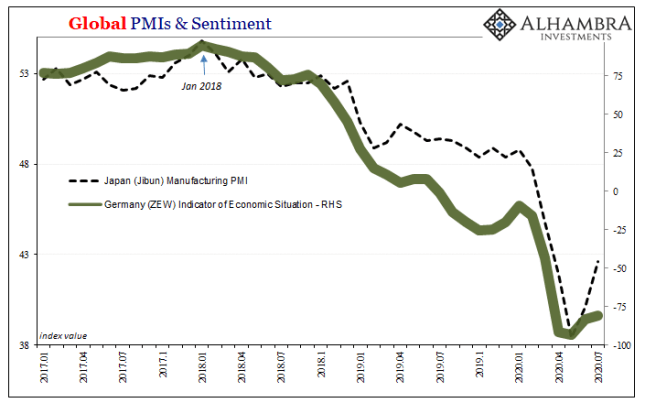 - Click to enlarge |
Industrial Production: Manufacturing, SA 2011-2020 - Click to enlarge |
|
Inside the PMI reports, all sorts of bad news which only part of which can be attributed to COVID and some renewed restrictions in activities.
The phrase “challenging demand conditions” is, obviously, a purposefully broad catch-all which includes the shutdowns and reopenings among a great many other potential factors (like closed businesses and millions of unemployed). There is far more going on than the coronavirus, as those unemployment figures keep emphasizing. |
Unemployment Insurance; Initial Jobless Claims, 1980-2020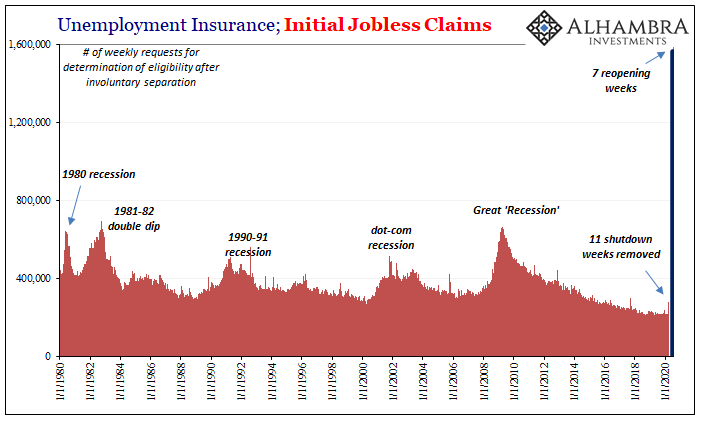 - Click to enlarge |
| In fact, out of the major flash PMI estimates released today by Markit, only Europe (driven by services) even approximates a small rebound. And that may be mostly attributed to the much larger depth of the trough than anything. While the composite index managed 54.8 in July, and while that’s the highest since April 2018, it, again, doesn’t mean what is being said about it.
Even Markit’s press release was (purposefully?) misleading, calling the “Eurozone businesses report strongest growth for two years in July.” Sure, but that’s actually pretty troubling when you take it further. |
PMIs & GDP (Europe), 2012-2020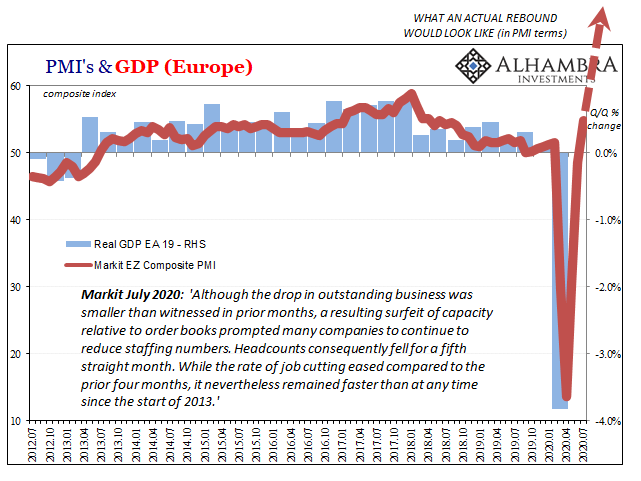 - Click to enlarge |
| Given how Europe’s economy has barely grown since Euro$ #4 showed up at the end of 2017, even the “best in two years” isn’t what it’s made out to be, either. And when combined with the fact that the European economy has just declined by the most ever (not shown above since Q2 GDP estimates aren’t out yet), the best in two years is actually downright pitiful even taking it the way Markit claims.
Like some other numbers, we really should be seeing gigantic positives in the PMI’s, too. But we aren’t. Why? After all, this is now two months into reopening and if non-economic factors were all that’s behind the “challenging demand conditions” worldwide, we’d have seen those gigantic PMI positives almost right away; should’ve been there in May. Instead, after falling at record rates, getting back to 50 three months after the bottom is alarmingly listless, outright contradicting the very notion of a rebound. Being the most charitable, moving a little bit off the bottom. Measured against US accounts like retail sales, which have been more “V” like, the difference is pretty clear – temporary government offsets to what otherwise has been, and still is, an enormous hole and enormously difficult economic (rather than strictly non-economic) set of circumstances. Producers in both manufacturing and services are acting very cautiously and it’s not all about the pandemic. |
PMIs & GDP (US), 2012-2020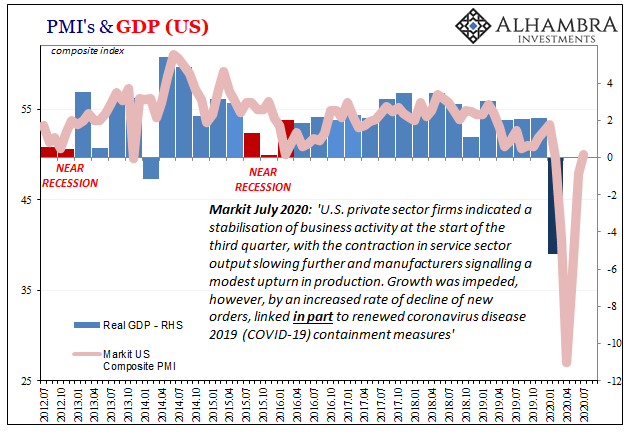 - Click to enlarge |
Full story here Are you the author?
Tags: currencies,economy,Europe,Featured,Federal Reserve/Monetary Policy,IHS Markit,Markets,newsletter


