


Jeffrey P. Snider
My articles My offerMy siteAbout meMy videosMy books
Follow on:LinkedINTwitterSeeking Alpha
|
What a difference a month makes. The euphoria clearly fading even as the positive numbers grow bigger still. The era of gigantic pluses is only reaching its prime, which might seem a touch pessimistic given the context. In terms of employment and the labor market, reaction to the Current Employment Situation (CES) report seems to indicate widespread recognition of this situation. And that means how there are actually two labor markets at the moment. Occupying the same geographic space but separated otherwise by every factor that’s meaningful. What’s driving the headline figures is only the first group, those workers who were let go if only because their place of employment was forced to close down for non-economic reasons.As the restrictions relax, this group gets to go back to work again – in June 2020 as in May 2020, in droves. It’s the other group that will mean all the difference, and right now they are being overshadowed at least so far as the employment numbers are concerned. Unemployment (insurance) numbers, however, this latter cohort remain as visible as ever. |
 . |
| First, though, the Establishment Survey. If +2.5 million was cause for out-of-control celebration, as it was a month ago, why has +4.8 million hardly registered? In the bond market in early June, yields spiked (on the 10-year to more than 90 bps). Today, yields are lower.
This really isn’t difficult to figure out. Despite the spin, we’re only seeing the one part of the labor market in these huge positive numbers. When I put some crude estimates on the back of the envelope last month in order to roughly sketch out this dichotomy, I had forecast (loosely speaking) how there could easily be something like +6 million (Household Survey) in the June labor report – and it wouldn’t mean much. That the Household Survey actually gained “only” 4.9 million in June indicates little by itself; it’s basically the same premise in the same ballpark as my 6 million, that we should expect these enormous, record-breaking employment numbers for at least several months. But we need to understand that these tell us only that the economy is being reopened, providing us little or no insight into how much economic damage it has absorbed while it wasn’t (with GFC2 having added a ton more negative pressure). That’s the other group in the labor market – workers who, for whatever original reason, were separated from their jobs and now have no job to go back to. |
Unemployment Insurance, Initial Jobless Claims, 2017-2020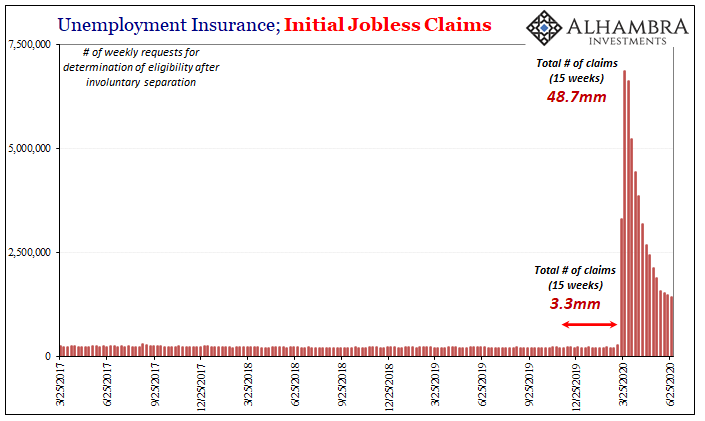 - Click to enlarge |
| They don’t show up in the BLS Current Employment Situation (CES) because they aren’t separated as such and are being buried by those fortunate enough to be hastened into the rush to reopen.
The payroll reports being dominated this way leave unemployment claims alone to illuminate the destruction underneath. Ongoing destruction; these figures continue to be alarmingly grim. The number of Americans filing their initial claim for unemployment insurance eligibility was another astounding 1.43 million during the final week in June. To put that into context, in the fifteen weeks before GFC2 the total number of claims amounted to 3.3 million. In other words, three months into this thing, initial claims in just one week were nearly half (43%) of that number. And it’s the fourth week in a row where progress (falling claims) has been measured by the smallest amounts yet. Being stuck around double the previous records for initial jobless claims points to far deeper, and more lasting economic impairment. |
Unemployment Insurance, Continued Claims, 2017-2020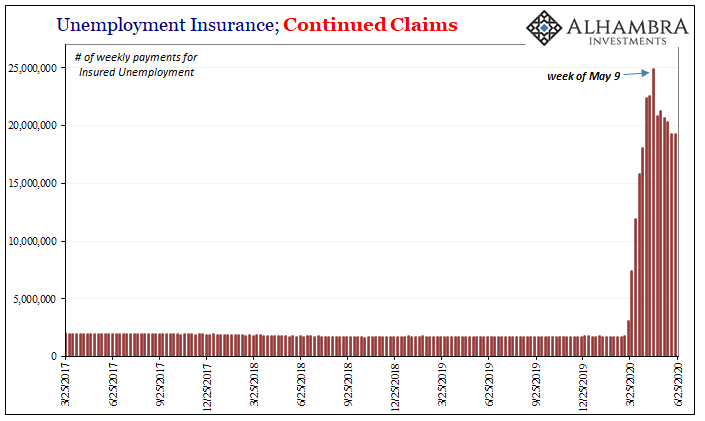 - Click to enlarge |
| In terms of continued claims, state governments are still paying on more than 19.3 million of them (a slight increase during the week of June 20 from the week prior).
But with 19.3 million continued claims, on top of more than a million initial claims week after week, that suggests we might already be nearing this reopening limit; jobs that were originally lost because of non-economic reasons today no longer exist anymore, and they are being joined by jobs that did initially survive the shutdown only to disappear several months into it. Another month maybe two of big positives and then the rush of jobs back because of governments lifting restrictions stops dominating the headlines. Leaving us instead with only the second group. |
. |
| That might not even push the payroll reports back into the minuses again – though that shouldn’t be ruled out – rather it will constrain this rebound action so that it falls well short of getting us back to anywhere near even. Thre going to end up way, way less than what we had when we started.
It’s how we end up that ultimately matters, leaving these gigantic positive payroll reports as little more than useless trivia (the “best” jobs report ever showed up during the worst economic climate the world had experienced in four generations!) And I believe that’s the difference between the extreme variation in the reception for each of the last two jobs numbers. These interim months being properly classified and therefore devalued. As I wrote at the beginning of this unusual and unique statistical window:
|
Labor Difficulties, 2014-2021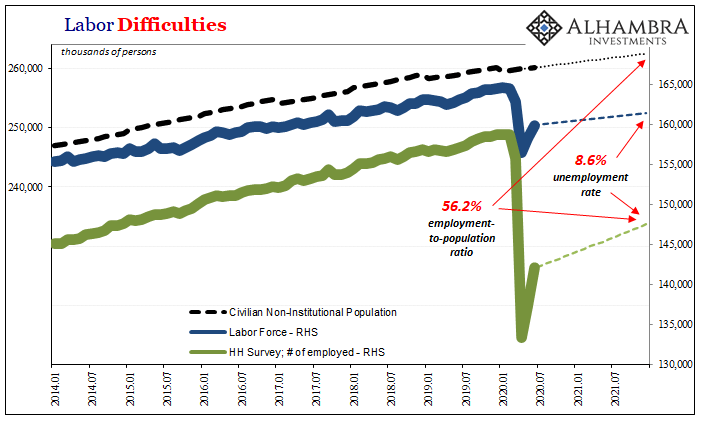 - Click to enlarge |
| If you aren’t careful, gargantuan positives can distract you from noticing the even more enormous hole and the tremendous damage you’ve already been stuck
It’s how we end up that ultimately matters, leaving these gigantic positive payroll reports as little more than useless trivia (the “best” jobs report ever showed up during the worst economic climate the world had experienced in four generations!) And I believe that’s the difference between the extreme variation in the reception for each of the last two jobs numbers. These interim months being properly classified and therefore devalued. As I wrote at the beginning of this unusual and unique statistical window:
Therefore, record employment estimates just weren’t all that surprising to anyone being honest about the situation. For the second month running, the CES (like PMI’s) only tells us the economy is being reopened. That’s it. |
CES Index of Aggregate Weekly Hours, 2008-2020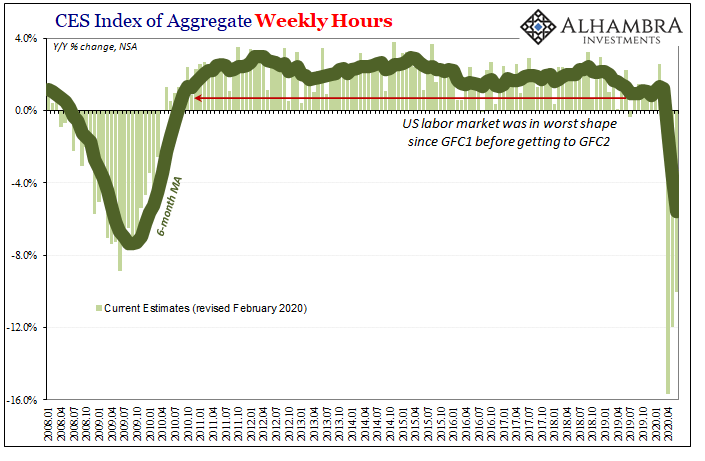 - Click to enlarge |
Full story here Are you the author?
Tags: currencies,economy,employment,employment report,establishment survey,Featured,Federal Reserve/Monetary Policy,household survey,Initial Jobless Claims,jobless claims,Labor Market,Markets,newsletter,payrolls,Unemployment Claims,unemployment rate


