


Jeffrey P. Snider
My articles My offerMy siteAbout meMy videosMy books
Follow on:LinkedINTwitterSeeking Alpha
|
Jay Powell’s 2018 case for his economic “boom”, the one which was presumably behind his hawkish aggression, rested largely upon the unemployment rate alone. A curiously thin roster for a period of purported economic acceleration, one of the few sets joining that particular headline statistic in its optimism resides in the lower tiers of all statistics. The sentiment contained within the ISM’s PMI’s were at least in the same area as the unemployment rate, and therefore they were upgraded and then relentlessly highlighted as if comprehensively irrefutable. With the unemployment rate, you could at least see why there was such an error. |
ISM Purchasing Managers Indexes, 2008-2020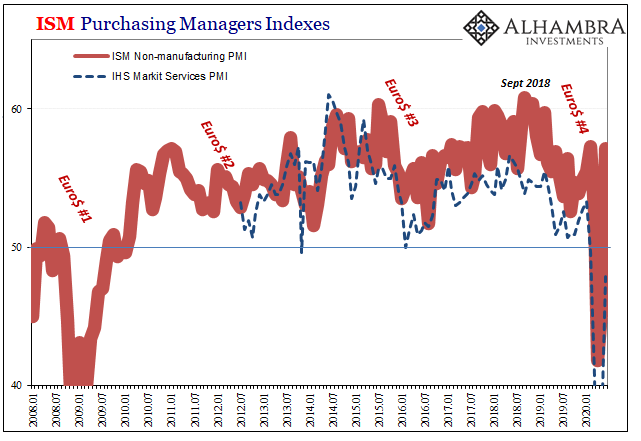 - Click to enlarge |
| The participation problem left the denominator improperly stripped of a large multitude of formerly American workers. Decried by Economists as merely lazy, it has been Economics (and its media) which was lazy in failing to seek out legitimate and reasonable answers for the ratio’s deficiency.
But how do we explain the ISM? To my knowledge, it’s never been properly characterized nor opened up sufficiently to illuminate this clear and quite obvious upward bias in both sets (below). Furthermore, this is a more recent development. For the non-manufacturing version, it dates back to mid-2015 or so, just in time to overhype Reflation #3 as perhaps globally synchronized growth. |
ISM Purchasing Managers Indexes, 2006-2020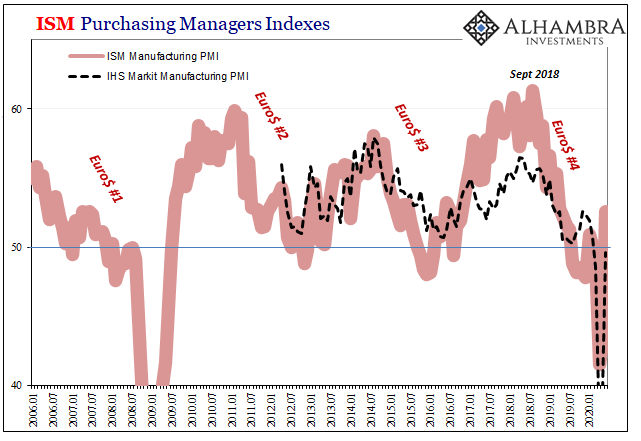 - Click to enlarge |
| The ISM Manufacturing PMI’s discrepancy goes back a little further, perhaps suggesting an answer for both of the organization’s indices. You may recall that on first estimation, before the data from the 2012 Economic Census was absorbed and added to the government’s economic statistics concerning manufacturing, the rebound during 2013-14 (Reflation #2) was more robust in a broad range of accounts (durable goods, factory orders, imports, etc.)
It wasn’t until subsequent benchmark revisions that the upturn in those years was whittled down practically to nothing, or what we see of it today (long after the public’s attention had moved on). While the ISM undergoes seasonal revisions, it does not substantially revise its prior readings. Therefore, when comparing the Manufacturing PMI to manufacturing-related accounts this underlying bias becomes quite noticeable. Not just in that specific revision-heavy period of Reflation #2, but even more so with Reflation #3 as if the words globally synchronized growth meant something to ISM respondents they sure didn’t in terms of hard data. |
ISM Purchasing Managers Indexes, 2006-2020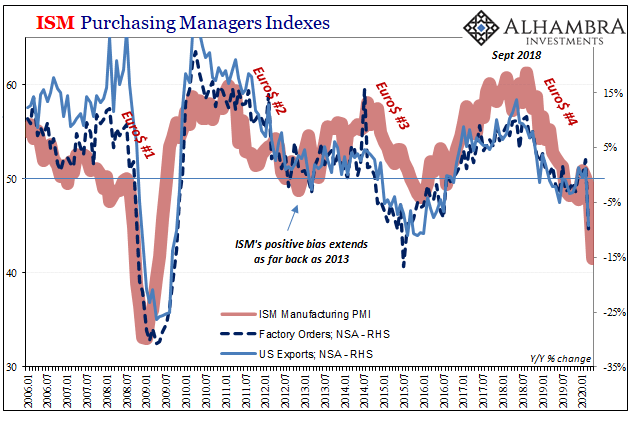 - Click to enlarge |
| Here in 2020, as the domestic and global economy reopens the paramount question isn’t one of the bottom, a rebound, or even some upside; it’s recovery and only recovery. PMI’s are already ill-suited for this job, especially since they are viewed and interpreted like they display economic levels. Not all 50’s are the same (nor 60’s, for that matter).
After a substantial decline, we would expect a substantial increase. That doesn’t mean recovery, necessarily, only suggesting that an inflection point has been reached. As I wrote last week:
|
IHS Markit US Composite, 2012-2020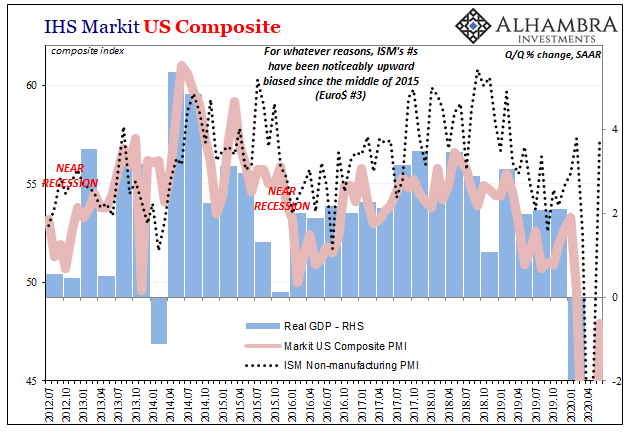 - Click to enlarge |
| That’s it. So, if very few purchasing managers are telling the government they are seeing growth, then that’s consistent with a sizable economic decline.
Once that decline has finished, for whatever reasons, we should expect meaningful acceleration – what we (used to) call recovery. First, though, the economy has to bottom out, which in the PMI’s means a transition from sub-50 to more than 50. That by itself, however, does not mean anything more. What separates the bottoming out process from the transition to recovery in PMI terms is higher levels being sustained for a significant period. The lower the trough, the higher the rebound. Symmetry counts. But even more than that, corroboration. If the economy is actually undertaking an actual recovery, it would be clear across a majority of accounts and statistics. A true upswing is powerful enough on its own to register clearly and widely, not the feverish upselling and overhyping of a few minor points. To begin with, examining the ISM, this shouldn’t have been the outlier in its own category. IHS Markit’s similar PMI indices, for example, never did climb aboard with the globally synchronized growth pandemic. These other sentiment indicators were far more consistent with Reflation #3 and nothing better; so, they were downgraded in the mainstream view despite being far more in line with practically every other measure including GDP. |
IHS Markit US Manufacturing, 2012-2020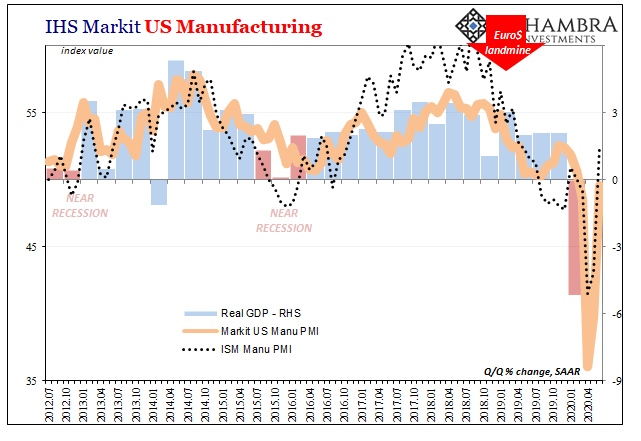 - Click to enlarge |
For June 2020, the ISM’s bias is back on display again. Last week, the group said its manufacturing PMI climbed up to 52.6 from 43.1 in May – after having been no lower than 41.5 at the trough in April.
Services, meanwhile, the ISM Non-manufacturing PMI today was reported to have leapt up as far as 57.1 last month from 45.4 the month before (and no worse than 41.8 in April). While that level would be consistent with only the bottoming out process, it’s not even consistent across PMI’s.
According to IHS Markit, on the other hand, its Services PMI remained firmly below 50 (47.9) even as it was upgraded significantly from its flash reading (46.7) released late last month. This latter number also suggests a bottoming out, but well behind in the process (still shrinking, though now at a substantially lesser rate) from where the ISM apparently sees it (no longer shrinking, instead already moving back upward again at a relatively decent, but so far insufficient, pace).
Therefore, take your pick while being mindful that neither set of numbers are equal to recovery. That’s the part the ISM proponents are leaving out, alongside any notion of this obvious upward bias. Further along in the rebound process isn’t the same thing at all.
In fact, I’d have expected much better by now; given the size of the decline and the fact that the bottom had been reached several months ago, where are the 60s maybe even 70s? Since we are following behind China’s reopening, I’ll end here with what I wrote in March about that:
When the index falls to something like 35.7 or 29.6, what that meant was a near complete drop across the whole range of businesses in both economic segments. If the rebound was as instantaneous as people seem to be interpreting from these figures, then the PMI’s should have been something like 60 or even 70.
All a 52 suggests when it follows a 35 is that it might not have gotten worse…To immediately jump to the conclusion that it must be getting better is being impatient.
Same with 57.1 – and that would have been with corroboration. Without it, as Markit proposes, people are being gratuitously impatient.
Full story here Are you the author?
Tags: currencies,economy,Featured,Federal Reserve/Monetary Policy,ihs markit manufacturing pmi,ism manufacturing index,ism non manufacturing index,Markets,newsletter,PMI


