


George Dorgan
My articles My siteAbout meMy videosMy books
Follow on:LinkedINTwitterSeeking Alpha
CFA SocietyEconomicBlogs
We do not like Purchasing Power or Real Effective Exchange Rate (REER) as measurement for currencies. For us, the trade balance decides if a currency is overvalued. Only the trade balance can express productivity gains, while the REER assumes constant productivity in comparison to trade partners.
Who has read Michael Pettis, knows that a rising trade surplus may also be caused by a higher savings rate while the trade partners decided to spend more. This is partially true. Recently Europeans started to increase their savings rate, while Americans reduced it. This has led to a rising trade and current surplus for the Europeans. But also to a massive Swiss trade surplus with the United States, that lifted Switzerland on the U.S. currency manipulation watch list.
To control the trade balance against this “savings effect”, economists may look at imports. When imports are rising at the same pace as GDP or consumption, then there is no such “savings effect”.
After the record trade surpluses, the Swiss economy may have turned around: consumption and imports are finally rising more than in 2015 and early 2016. In March the trade surplus got bigger again, still shy of the records in 2016.
Swiss National Bank wants to keep non-profitable sectors alive
Swiss exports are moving more and more toward higher value sectors: away from watches, jewelry and manufacturing towards chemicals and pharmaceuticals. With currency interventions, the SNB is trying to keep sectors alive, that would not survive without interventions.
At the same time, importers keep the currency gains of imported goods and return little to the consumer. This tendency is accentuated by the SNB, that makes the franc weaker.
Texts and Charts from the Swiss customs data release (translated from French).
Exports and Imports YoY DevelopmentThe containment decreed in Switzerland and in many countries due to the coronavirus pandemic has also impacted Swiss foreign trade. In April 2020, both exports and imports fell sharply. In seasonally adjusted terms, outflows fell 11.7% and inflows fell 21.9%. In both directions of traffic, this was the largest monthly deterioration in decades. The trade balance closed with a surplus of 4.3 billion francs. In short▼ Jewellery and watchmaking exports: -1.6 billion francs ▼ Exports to France and Italy at their lowest level in 20 years ▼ Imports Return To July 2005 Levels |
Swiss exports and imports, seasonally adjusted (in bn CHF), April 2020(see more posts on Switzerland Exports, Switzerland Imports, )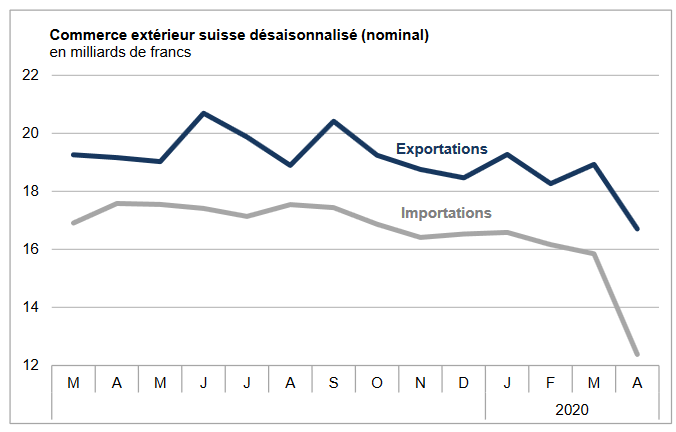 - Click to enlarge |
Global evolutionCompared with the previous month, April 2020 exports contracted by 11.7% (actual: -10.0%); this is the largest seasonally adjusted decline ever recorded. They retracted by 2.2 billion to reach 16.7 billion francs. Imports even plunged by 21.9%, that is, by a drop of 3.5 billion francs, to 12.4 billion francs (actual: -17.8%); they thus fell almost to their July 2005 level. The trade balance closed with a record monthly surplus of 4.3 billion francs. |
Switzerland Trade Balance, April 2020(see more posts on Switzerland Trade Balance, )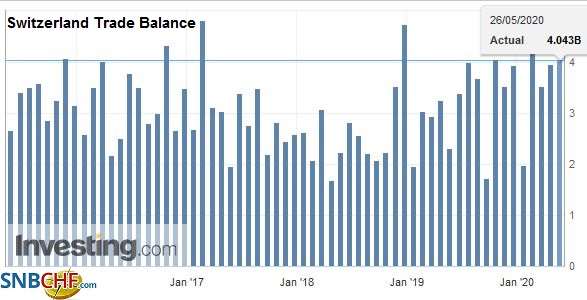 Source: investing.com - Click to enlarge |
| Exports to North America: -30% after their take-off in the previous month
All export sectors fell in April 2020. Exports of jewelery (-77.0%; other merchandise) and watchmaking (-72.6%) were the hardest hit; their cumulative decline reached 1.6 billion francs. Sales of chemicals and pharmaceuticals fell by 520 million francs (-4.8%), after having nevertheless taken the lift the previous month (drugs: + 35.5%). In April, it was above all drugs that broke the dark (-1.5 billion francs) while immunological products swelled by 600 million francs. The machinery and electronics (-4.5%), precision instruments (-18.2%) and metals (-13.1%) sectors, meanwhile, posted a cumulative decline of CHF 470 million. Exports to the three main markets turned red over a month. Those to North America were the most affected (-30.4%; USA: -1.6 billion francs), after having jumped 37.7% the previous month (base effect). Europe also showed a regression (-13.1% or -1.4 billion); this mainly concerned neighboring countries (total: -1.1 billion). Deliveries to Italy and France fell to their lowest level since April 2001 and January 1998, respectively. The United Kingdom also suffered (-152 million). Asia suffered the same fate (-7.9% or -306 million), weighed down in particular by the drop in shipments to Hong Kong (-142 million) and the United Arab Emirates (-61 million). |
Swiss Exports per Sector April 2020 vs. 2019(see more posts on Switzerland Exports, Switzerland Exports by Sector, )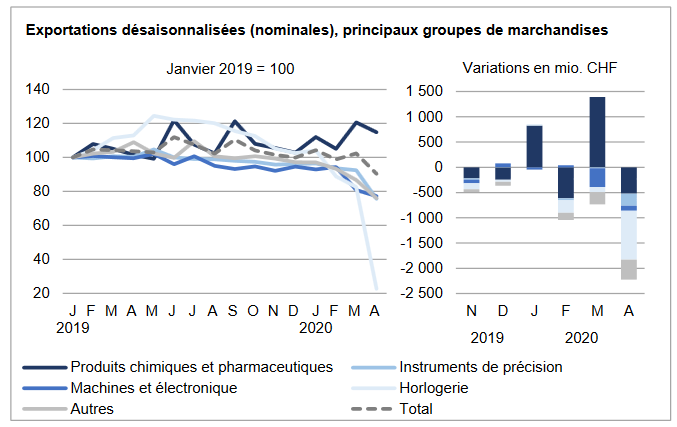 - Click to enlarge |
| Passenger car imports: plunge of 435 million francs or 66%
In April 2020, imports fell 21.9%, or 3.5 billion francs, from the previous month. 70% of the decrease (2.4 billion francs) came from three groups: jewelery (- 972 million francs; other goods group), chemicals and pharmaceuticals (-791 million) and vehicles (- 661 million). Within this latter group, arrivals of passenger cars deflated by two thirds (-435 million). With the exception of the textiles, clothing and footwear sector, all the others fell. Imports from the three main supply markets have deteriorated significantly. North America faltered by a quarter (-285 million francs) against 22% for Asia and 20% for Europe. The Old Continent thus fell back to its May 2000 level. The cumulative decline with our four neighboring countries reached 1.6 billion francs. Arrivals from France contracted particularly (-486 million or -40.7%). On the Asian side, the fall of Hong Kong and the United Arab Emirates sealed the result (total: -416 million; mainly gold jewelry for the redesign). Conversely, deliveries from China (+171 million) posted a second consecutive monthly increase. |
Swiss Imports per Sector April 2020 vs. 2019(see more posts on Switzerland Imports, Switzerland Imports by Sector, )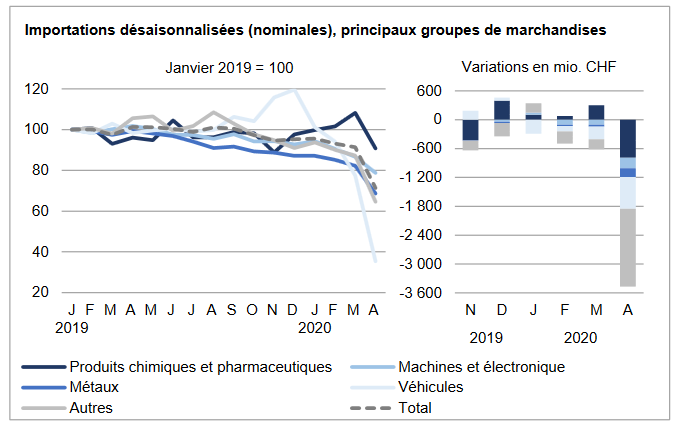 - Click to enlarge |
Tags: newsletter,Switzerland Exports,Switzerland Exports by Sector,Switzerland Imports,Switzerland Imports by Sector,Switzerland Trade Balance


