|
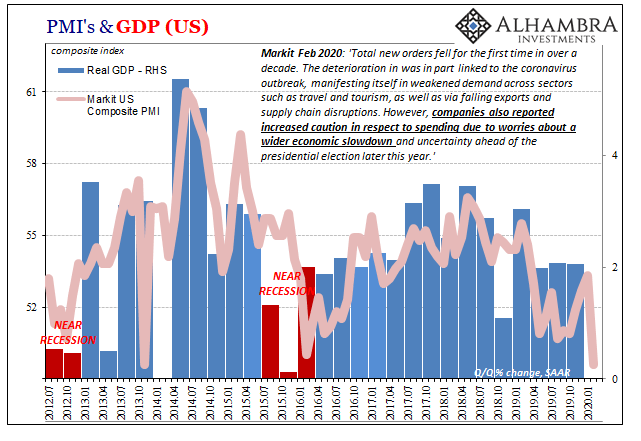
Take your pick, apparently. On the one hand, IHS Markit confirmed its flash estimate for the US economy during February. Late last month the group had reported a sobering guess for current conditions. According to its surveys of both manufacturers and service sector companies, the system stumbled badly last month, the composite PMI tumbling to 49.6 from 53.3 in January. Today’s update to that flash estimate with more survey responses in hand validated the 49.6. |
PMI's & GDP, 2012-2020 |
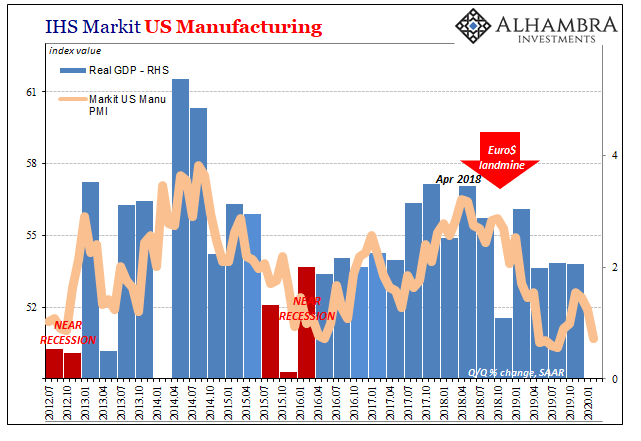
IHS Markit US Manufacturing, 2012-2020 |
|
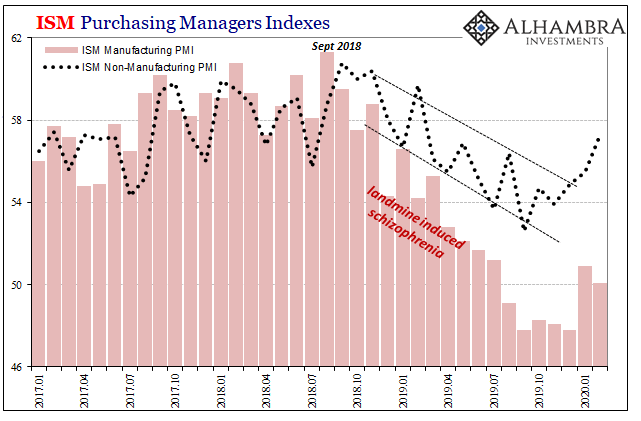
| On the other hand, the ISM’s Non-manufacturing PMI surged ahead. According to this other outfit, the services part of the US economy is rebounding nicely from weakness last fall. Up to 57.3 for last month, that’s the highest in a year and continues what looks to be the trend Jay Powell and his ilk have been talking about.
So, which one is it? |
ISM Purchasing Managers Indexes, 2017-2020 |
| While it may seem like an either/or situation, more likely it’s down to a matter of timing. After all, it was Markit’s figures that had first figured on a rebound. Its manufacturing index had bottomed out all the way back last August, as had the composite. Both of those had suggested a modest upswing, maybe a bottom, before more recent months.
Markit’s manufacturing PMI had peaked in November and turned lower in December, a trend that continues in this series into February. The composite’s sharp drop in February emphatically joined this view of the US service sector with that growing negative possibility. As that was going on late in 2019, the ISM’s two PMI’s had been still falling. |
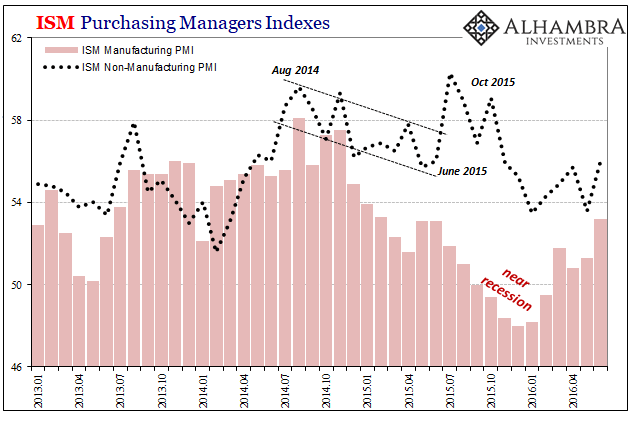
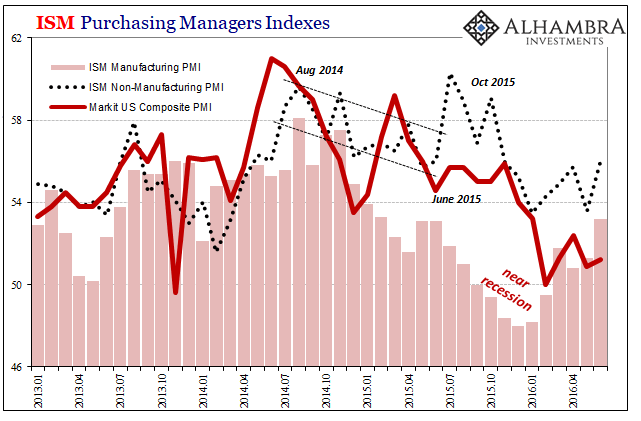
ISM Purchasing Managers Indexes, 2013-2016 |
| They wouldn’t pick up the rebound, likely midpoint, until several months after the Markit figures. The ISM Manufacturing index would get as low as 47.8 in December before a sharp uptick in January to 50.9 (which is down to 50.1 again in February, so you know where these are going, too).
This isn’t the first time we’ve recorded this big of a divergence among these sets, either. Nor is it for the ISM on its own on the upswing. Going back to the middle of 2015, it had worked out to largely the same thing. |
ISM Purchasing Managers Indexes, 2013-2016 |
| After an initial drop in the ISM Non-manufacturing PMI beginning with September 2014, by July 2015 (just as Euro$ #3 really started to get going in its second phase) this measure like today was suggesting an economic rebound that wasn’t found anywhere else. This particular index even got as high as 60.3 – just as the bottom nearly fell out from under the US economy (it did globally).
And, also like today, that differed substantially from the view provided by Markit’s surveys purportedly of the same economic segment. That’s probably why there was no reaction by either stocks or bonds to the ISM when it was released at 10am this morning. It was old news already, overtaken by concerns that aren’t as likely to be outliers. Or, as this afternoon, virus-related “stimulus.” As I wrote all throughout those last months of 2019, it was a pretty substantial warning that Treasury yields (or those for German bunds) didn’t back up more than they actually did over the course of 2019’s final quarter. The US 10-year, for example, never reached 2% let alone something like 2.25% (or even higher, following the Euro$ #3 midpoint example).
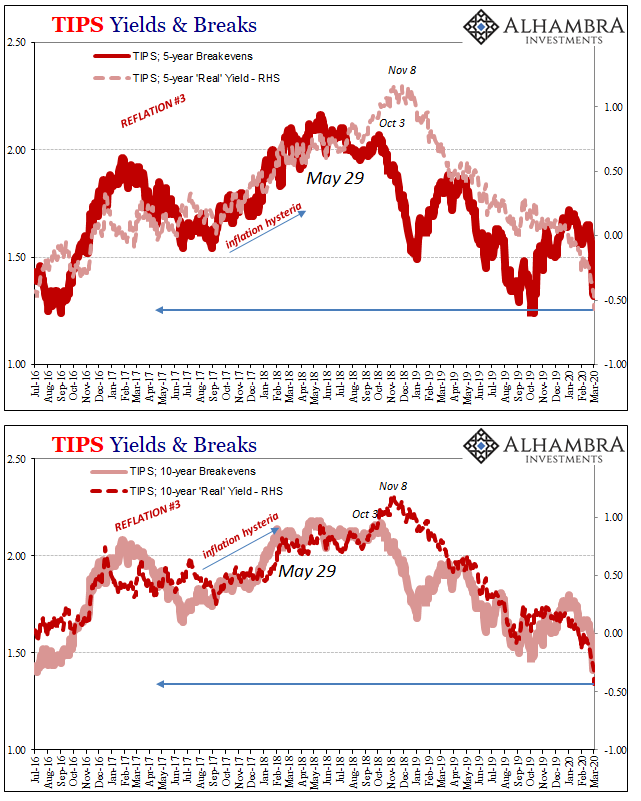
Long before the coronavirus was a thing (see: real TIPS yields below), the bond market was discounting every possibility of a legitimate or lasting economic rebound. And now yields are almost a full percent lower still; while stocks aren’t so certain about the risks and the state of the world. |
TIPS Yields & Breaks, 2016-2020 |
Full story here Are you the author? Previous post See more for Next post
Tags: Bonds,currencies,economy,Euro$ #4,Federal Reserve/Monetary Policy,ihs markit manufacturing pmi,ism manufacturing index,ism non manufacturing index,Markets,newsletter,PMI


