Revised estimates from the Federal Reserve are beginning to suggest another area for concern in the US economy. There hadn’t really been all that much supply side capex activity taking place to begin with. Despite the idea of an economic boom in 2017, businesses across the whole economy just hadn’t been building like there was one nor in anticipation of one.
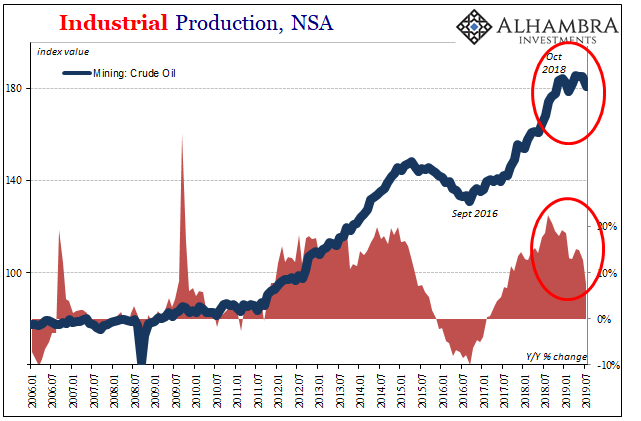
| The only place where there was a truly robust trend was the oil patch. Since the last crash a few years ago, Euro$ #3, the oil sector rebounded and quickly. Leading the way was WTI up from its chaotic low point in February 2016. It’s arguable where the breakeven or profit point is for shale plays, regardless producers will dig new wells at lower price points if they expect the crude price to keep going up.
If they begin to question that assumption, then the danger is revisiting 2015. In terms of price, WTI crashed all over again (from a lower starting point) beginning in October 2018 and the Fed’s new revised benchmarks for Industrial Production suggest that might be happening. |
Industrial Production, NSA 2006-2019 |
| It is by no means a full-scale reverse at least not yet. The new estimates do suggest, however, a growing halt to new activity as the price of crude continues to languish. Unless WTI rediscovers that upward trajectory, the one place that was going right will become another headwind for the economy and headache for supposedly one-and-done Jay Powell.
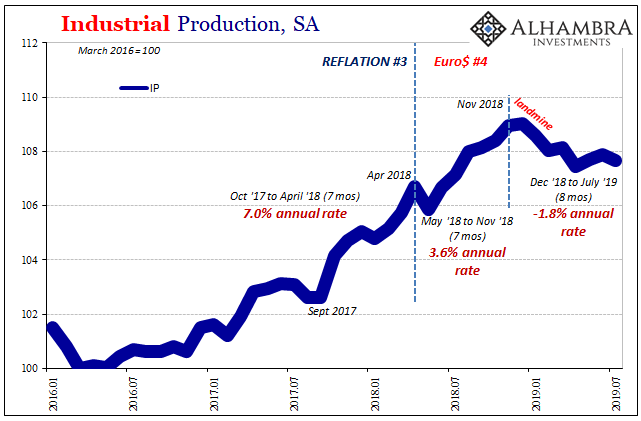
The rest of the IP data merely forward that theme for another month – economic headwinds, or cross currents using the 2019 terminology (being otherwise exactly the same as prior Fed Chairman, apparently Chairman Powell will try to distinguish himself by ever so slightly changing up the lingo). |
Industrial Production, SA 2016-2019 |
| It’s not nearly as far along as in Germany or China, the US economic reverse following the Euro$ landmine is pretty obvious nonetheless. It follows from consumer spending and retail sales: significantly weaker sales growth leads to an inventory pile up and then correction. Wholesalers in particular are stuck with the excess and they have little other option than to call a halt on production. |
Industrial Production, SA 2016-2019 |
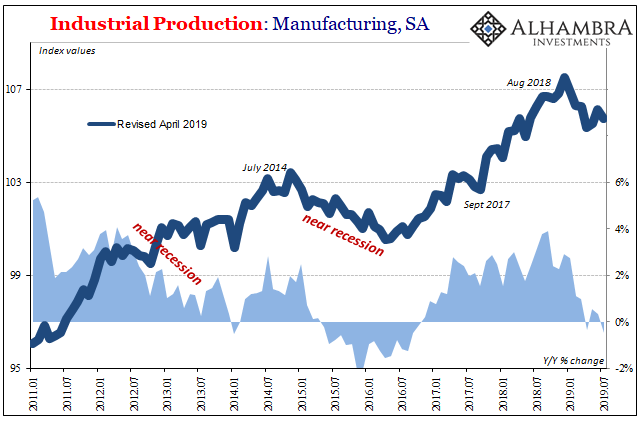
Industrial Production: Manufacturing, SA 2011-2019 |
|
| While the reverse for US industry is broad-based, it is most pronounced (so far) in manufacturing. The Fed estimates that manufacturing levels are lower now than they were a year ago. Over the last eight months since the landmine, manufacturing IP is falling at a 1.5% annual rate.
Given the pretty substantial inventory imbalance, that’s likely to get much worse before it gets better – unless sales at the top end (retailers) really do pick up substantially and fast. |
|
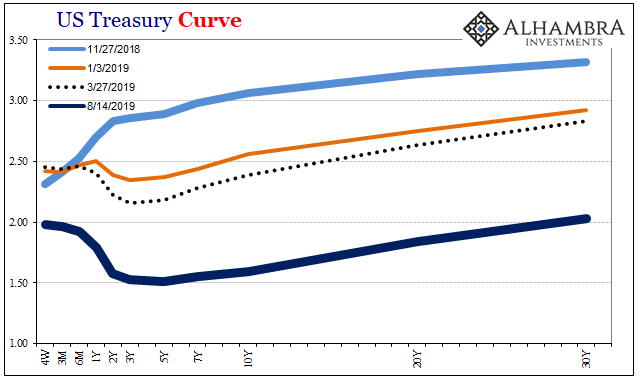
| With regard to consumer spending, all available data suggests that’s not happening (which is also the bond market view). As it relates to manufacturing, there’s a lot which indicates the inventory cycle is just getting started. |
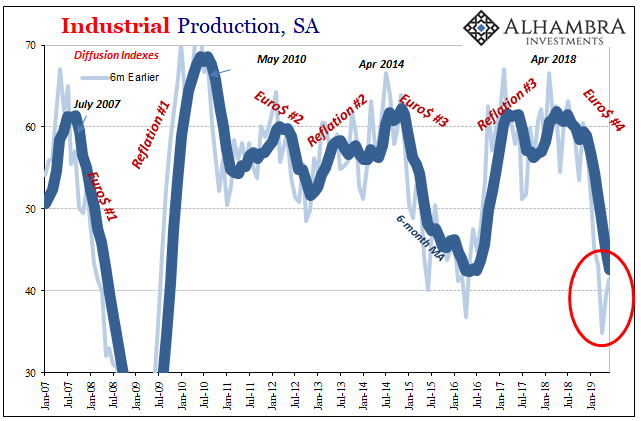
Industrial Production, SA 2007-2019 |
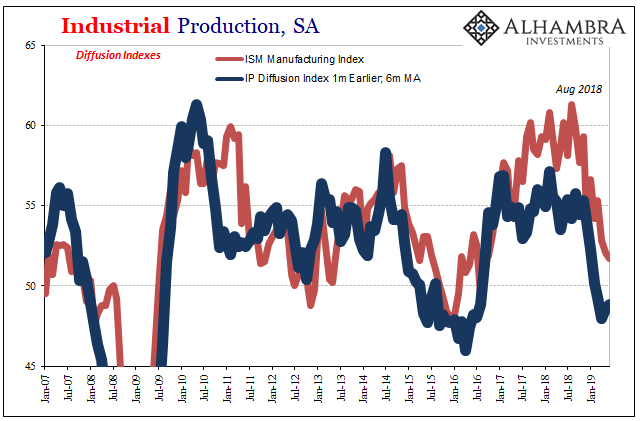
| The IP diffusion indices (which measure change in individual components of IP rather than orders or sentiment) already illustrate the broad-based nature of the growing reverse (the low levels of these indices show that the decline is not due to just one or a couple isolated sectors, it’s nearly every sector). They also correlate very well with other diffusion indices which do measure sentiment and more forward-looking series (like the ISM Manufacturing PMI). |
Industrial Production, SA 2007-2019 |
| In other words, an industrial economy already experiencing a broad-based and sustained reverse which will in all likelihood be amplified once doubts in the oil sector spread and inventory keeps piling up and doesn’t look like it’s going to turn around anytime soon.
Manufacturing and industry in the US might not be anywhere near as bad off as Germany and China, but they are definitely on the same spectrum. Whether it is enough of an underlying “cross current” to push the US economy into recession like Germany is an open question. In any event, the risks of something like that are rising as this is not the kind of data which leads any rational person to think one and done. |
US Treasury Curve(see more posts on U.S. Treasury, ) |
Tags: Bonds,currencies,economy,Federal Reserve/Monetary Policy,industrial production,Inventory,inventory cycle,manufacturing,Markets,Mining,newsletter,OIL,oil production,recession,U.S. ISM Manufacturing PMI,U.S. Treasury,WTI


