


Jeffrey P. Snider
My articles My offerMy siteAbout meMy videosMy books
Follow on:LinkedINTwitterSeeking Alpha
The fact that the mainstream isn’t taking this all very seriously isn’t anything new. But how serious are things really? That’s pretty much the only question anyone should be asking. What are the curves telling us about what’s now just over the horizon?
I hesitate to use 2008 comparisons too often because many people immediately jump to extrapolations, especially in these more esoteric market indications. If you say something is like 2007 or 2008, people think you are saying we are on the road to repeating 2007 and 2008.
What we are trying to do in making these relative assessments is only to gauge just how serious this trouble might turn out to be. Things like eurodollar futures in 2007 were warning that some very substantial downside was showing up in the real monetary system, and therefore major risks to the real economy.
| If we see something similar today, it doesn’t necessarily mean there’s another Bear Stearns or Lehman Brothers lurking underneath. It would only propose substantial risks that should not be so cavalier in factoring. It’s way too easy to dismiss something simply because Economists don’t understand it, and therefore it doesn’t come out in the mainstream media.
But as in the summer of 2007, officials were similarly dismissive. They were overly sanguine about monetary and economic prospects because they hadn’t yet been shown how central banks weren’t central (Economists and central bankers still haven’t conceded to this reality, which is why we are right back here again for a fourth time in a decade plus). Bernanke said “subprime was contained” in March 2007. Bill Dudley did him one better, telling the FOMC “there was nothing imminent” just two days before the whole damn thing broke apart. |
Money Markets Equivalents, 2007-2008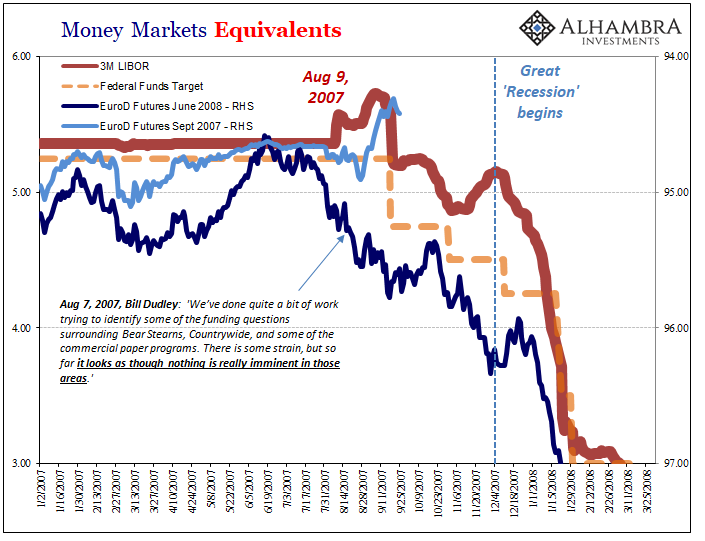 - Click to enlarge |
| The day he said that, August 7, 2007, the June 2008 eurodollar futures contract was trading at a price of 95.19. The front month September 2007 contract closed at 94.705. In other words, two days before the system fell apart the curve from the front to June the following year was inverted by a substantial number, 48.5 basis points.
It wouldn’t jump to 75 bps inverted until the end of August 2007, mere weeks before the first rate cut (50 bps) “unexpectedly” followed. |
Eurodollar Futures June 2008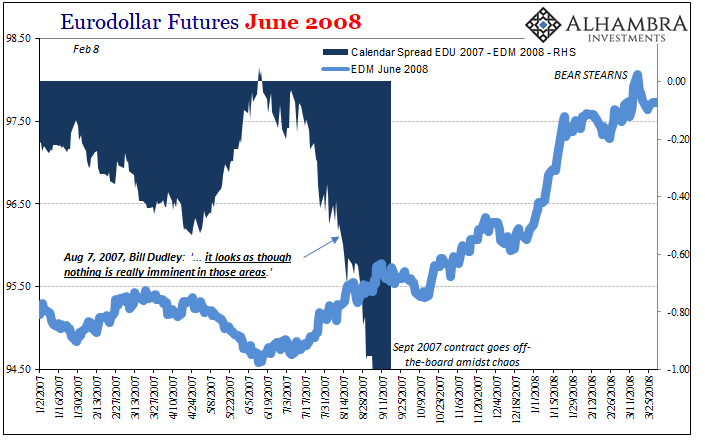 - Click to enlarge |
| Taken literally, it would’ve said the market was expecting about two rate cuts (or one at fifty) by the middle of 2008. But that’s not what it really meant.
The inverted curve was and is a probability distribution which was thinking first about whether rate cuts would happen before discounting how many and when they would start. The curve inversion after August 2007 quickly moved to propose a series of them lasting well into 2008. And that’s just how it unfolded. Right now, using June 2019’s contract as our front month measure, the inversion out to June of next year (EDM 2020) is up to a startling 76 bps already. That’s more than 20 bps upside down (toward future rate cuts series) than it was in early August 2007. |
Eurodollar Futures Junes 20089-21 - Click to enlarge |
| Again, this doesn’t mean we are already into a 2008-style meltdown. This curve does, however, suggest that the downside risks now right in front of us are very, very serious.
The probability distribution, like in the summer of 2007, anticipates first a rate cut to start sooner than the mainstream admits is possible followed by a series of them reaching down maybe to the nominal floor. And remember, in 2007 the nominal money rate began its descent from around 5.25%. That’s how far it had to drop before reaching ZIRP. Today, the RRP starts three hundred basis points lower, currently 2.25%. It’s not that the probability of a rate cut is in question, it no longer is, we are now wondering what the chances of renewed ZIRP might be. This historical comparison tells us they are far higher than maybe you think. There’s real trouble here. Certainly way, way above what central bankers and Economists are forecasting, those unserious people still holding fast to a second half rebound (also like 2007) and misunderstanding the very clear messages and warnings of the bond market (it’s a damn roadmap). These are extremely serious current risks where ZIRP is already back on the table today, the only way the 2008 comparison is helpful. Ask yourself, what has to happen for that to happen? It’s the beginning of June 2019 and the eurodollar curve has already sailed well past where it was August 9, 2007. Do you hear the alarm bells yet? If you haven’t, thank Economics where almost everything is backward and upside down. |
 . |
Tags: Bonds,currencies,economy,eurodollar futures,eurodollar futures curve,Federal Reserve/Monetary Policy,Markets,newsletter,rate cuts,ZIRP


