


Keith Weiner
My articles My offerMy siteAbout meMy videosMy books
Follow on:LinkedINTwitterSeeking AlphaFacebookAmazonGoogle +
A number of commentators have predicted that the rules of the Basel III bank regulations will cause gold to skyrocket (no, this article is not about our view that gold does not go up, that it’s the dollar going down, that the lighthouse does not go up, it’s the sinking ship going down in the storm).
Will it? It would be easy to say—as with all of their other predictions of gold to infinity and beyond—“wait and see.” But where’s the fun in that? We’d rather look into the nature of the claim, how banks operate, and what the regulation actually says.
So who wants to understand a bank balance sheet, and regulators’ view of bank risk? In other words, who wants to understand whether gold will skyrocket?
If you’re still with us, we assume you do. We will try to keep this brief.
The Bank Balance Sheet
A bank borrows to finance its lending. It makes money, by paying a lower interest rate on its borrowing than it charges on its lending. We can shortcut the language of borrowing and lending, and simply say that banks issue liabilities to fund their assets.
We will not focus on the interest rate differential, as it is not essential to our discussion today. Except one thing is important. Long-term bonds normally pay a higher interest rate than short-term notes (though right now, the market is backwards, called yield curve inversion, where 10-year Treasury bonds pay a lower rate than 1-month Treasury bills).
This gives banks a strong incentive to use short-term liabilities to fund long-term assets. The cost of funding is lower, and the interest earned on the asset is higher. But this creates a risk. To see it, let’s use an extreme case: using demand deposits to fund 30-year mortgages. According to the FDIC, as of this writing, the national average for checking accounts is 0.06%. According to the St. Louis Fed, a 30-year mortgage is 4.28%. A bank could make 4.22% by funding 30-year mortgages with checking deposits (before expenses). Not a bad business. But there’s a catch.
Depositors can withdraw their funds by writing a check!
And they would do so as the slightest suggestion that the bank was risky. The issue is not whether the bank is solvent by conventional measures. The accepted definition of solvent is assets > liabilities. Or, perhaps, revenues > expenses. That’s not the issue here.
The bank with checking deposit liabilities and 30-year mortgage assets is not insolvency. The problem is the mismatch of maturities. Keep in mind that liabilities are the source of funding. Picture borrowing from Peter to lend to Paul (Paul pays you 5% and you pay Peter 2%). If Peter demands his money back, but your contract with Paul says that he can pay it over 30 years, you are caught in the middle.
The first thing a bank would do in such a situation, is try to sell the mortgage. There is a market for mortgages, and if the bank can sell the mortgage at full value, then the problem is solved. It can pay the depositor.
However, if all banks were engaged in this extreme degree of maturity transformation, then two things are certain to happen. One, the scheme will blow up. And two, when it does blow up, the mortgage market will go no bid. Just when the bank needs to sell mortgages, other banks need to sell also. And there will likely be no buyers.
Banks will be either unable to sell mortgages, or they will incur dreadful losses if they are forced to stoop to whatever bid they can find. This is the recipe for not just a run on one bank, but a financial crisis.
Risk as Perceived by Regulators
Note that there are two separate problems here. There is a risk that the liability could be pulled at any time, and there is a risk that the asset might only be saleable at a loss.
The liabilities of a bank, in aggregate, represent its capital. A bank has several different types of capital that it can use. There is a spectrum of risk, ranging from equity on one side to demand deposits (or interbank borrowing) on the other.
Since the bank’s owners have no right to make the bank buy back their shares, bank equity capital is the safest capital. But the downside is that it is also very expensive. No bank can be in business by selling shares to lend the cash raised. Banks want to use equity sparingly.
Demand deposits are much cheaper (basically free in the US). As we showed above, the downside is that demand deposits can be pulled at any time.
In between equity and demand deposits are other liabilities, such as long-term bonds. A bank can sell 10-year bonds. The cost is much higher than demand deposits, but lower than equity. Or it can take time deposits, say a 5-year CD.
On the asset side, there is also a spectrum of risk, ranging from short-term Treasury bills on one extreme, to long-term mortgages on the other. A bank might buy only short-term bills. That would be safe, but not profitable as they don’t normally pay much. Or it could buy long-term bonds, but as we showed above, the risk is that if the bank needs to sell it will incur a big loss. And that loss can further break down into variability of the value of the collateral (residential real estate in this case) and bond market conditions.
If banks were strictly private companies, the banks would find ways to operate safely. The equity holders bear the first risk of loss, so the owners would have every incentive to manage risk prudently. Indeed historically, when they were free to do so, they did so.
But today they are not.
We have a pervasive regime of moral hazard. There is deposit insurance, monetary policy, lender of last resort, and of course bailouts. The net effect is to socialize losses, which offers a totally different incentive to bank owners. Moral hazards encourage banks to take as much risk as they can get away with, since gains are theirs to keep.
To compensate for this perverse incentive, they enacted banking regulation.
Regulatory Policy
Banking regulators attack each side of the balance sheet separately. For the liabilities—again, this side is called “capital”—there are tiers. The regulator’s goal with capital is to estimate how much capital the bank can rely on, when it’s under stress. That is, how much of its funding will not or cannot be pulled by investors who are under their own stress or simply panicking.
For the assets, regulation sets risk weightings. The regulator wants to assess the likely liquidation value of each asset, not in normal times but when the market is under stress. This includes the risk that the issuer of the asset (e.g. bond) will default, and the risk that the value of the underlying collateral or the instrument itself, could be lower.
There are formulas and the details get complicated. But the essence of this idea is captured in the concept of Net Stable Funding Ratio. This is a calculation of how much funding (liabilities) will be there relative to how much funding each assets need. Equity capital and long-term bonds are considered very stable. Demand deposits and interbank overnight lending are not. T-bills are considered not to need stable funding, as they can always be liquidated or will mature quickly. Mortgages need a high ratio of stable funding.
If you picture the bank getting pinched by twin pincers, that’s right. One is that funding is pulled by bank creditors, while the other is that the bank struggles to sell assets to repay them.
And now we get to gold.
Commentators have been claiming that under Basel III regulations gold will soon be a “tier 1 asset”. To go back to our favorite quote from physicist Wolfgang Pauli, that’s not even wrong. As we discussed, tiers refer to a bank’s capital which means its liabilities. How it funds its portfolio of assets. This is not where gold fits.
Gold Under Basel III
Gold is an asset. Under the new regulations, gold is assigned a Required Stable Funding of 85%. This is up there with equities. In other words, regulators see it as risky to hold gold, so they want to make sure that banks fund it mostly using liabilities that cannot be pulled. With expensive liabilities.
The gold community should not be cheering this as good for gold. We should be screaming bloody murder. Gold is not risky, like equities. Gold has no default risk, and its price risk is not that high. In fact, if a balance sheet holds a small amount of gold, it acts as a hedge. It reduces drawdowns (we plan to publish a paper on this soon).
The World Gold Council submitted comments to Federal Reserve, on the proposed rule “Enhanced Prudential Standards and Early Remediation Requirements…” It argued that gold should be included in the definition of “highly liquid assets”, and should not require term funding under the Net Stable Funding Ratio.
The World Gold Council included quotes from HSBC, UBS, and other banks and banking associations, as well as the London Bullion Market Association. They each argue for a low or zero Required Stable Funding.
Basel III assigns gold an 85%, which is the opposite of low.
The Physical vs Paper Gold Nothingburger
We did come across one other error from the golderatti, which we think is worth noting. Much ado was made of the distinction between paper gold vs. gold bars held in a bank’s vault or in trust. This, it was argued, will disincentivize the bank from trading paper gold. We are told that suppresses the price, and browbeaten with the false claim that each physical ounce is “papered 92 times over”. Instead, according to this misconception, banks will want to own real gold bars in preference to paper contracts.
However, the Office of the Comptroller of the Currency, the Fed, the FDIC, and the Office of Thrift Supervision, put out a document that shows otherwise:
“A bank may assign a risk-weighted asset amount of zero … for gold bullion held in the bank’s own vaults or held in another bank’s vaults on an allocated basis, to the extent the gold bullion assets are offset by gold bullion liabilities [emphasis added].”
Yes, a gold metal asset has the same zero risk-weighting as cash—if the gold asset is funded by a gold liability. What is a gold liability? It is everything that the gold commentariat hates: short gold futures positions, gold swaps, etc.
In other words, it’s the carry trade that we write about every week in our Supply and Demand Report!
Banks can own physical and sell futures, to make a small spread. In this case, the banks don’t need to reserve extra funding for gold, as the market risk of the gold price is hedged. In the parlance of our day, this whole assertion of physical gold being treated preferentially to paper is a big nothingburger.
Supply and Demand Fundamentals
The only part of our April Fools article yesterday that was not said with tongue firmly planted in cheek was the gold and silver price action (though framed it in the common dollar-centric parlance, being April Fools):
“Gold went down $21, while silver dropped about 1/3 of a dollar. Not quite a heavy metal brick in free fall, but close enough.”
It also turned out that our bitcoin call was prescient (though said in jest):
“The technicals say “buy” because, bitcoin is just breaking out above its Bollinger band, the RSI is high but not above 70, MACD is good, and because hope springs eternal. But mostly because hope springs eternal.”
Bitcoin was up on late Monday over $1,000 or almost 25%. In about 45 minutes. It is fading as we write this. Indeed, all markets traded today the way they are “supposed” to trade. That is: selling Treasurys to buy everything from junk bonds to commodities. The inflation bet is that the Fed can continue to force/induce them to keep doing this and doing it for years more. Maybe…
We will just say that, unlike a junk bond, gold has no risk of default. And unlike real estate, gold has no risk of widening bid-ask spreads.
Gold and Silver PriceAnyways, let’s look at the only true picture of the supply and demand fundamentals of gold and silver. But, first, here is the chart of the prices of gold and silver. |
Gold and Silver Price(see more posts on gold price, silver price, )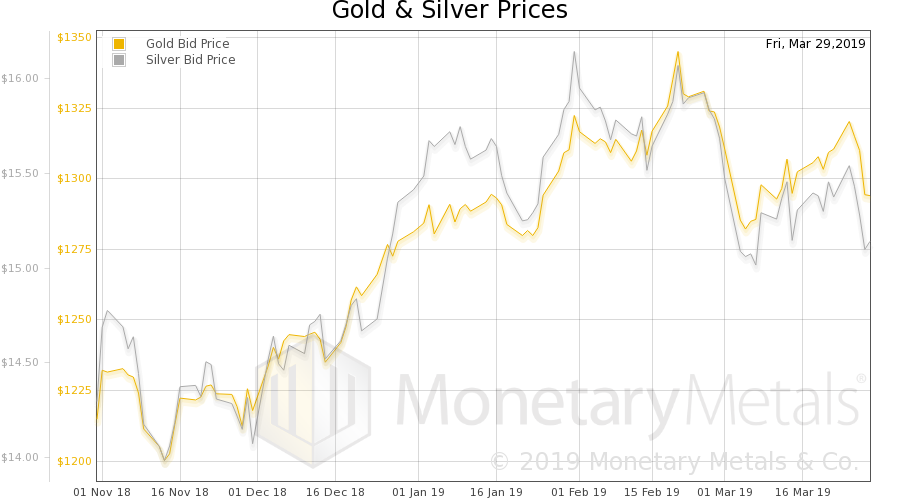 - Click to enlarge |
Gold: Silver RatioNext, this is a graph of the gold price measured in silver, otherwise known as the gold to silver ratio (see here for an explanation of bid and offer prices for the ratio). It was up this week. |
Gold:Silver Ratio(see more posts on gold silver ratio, )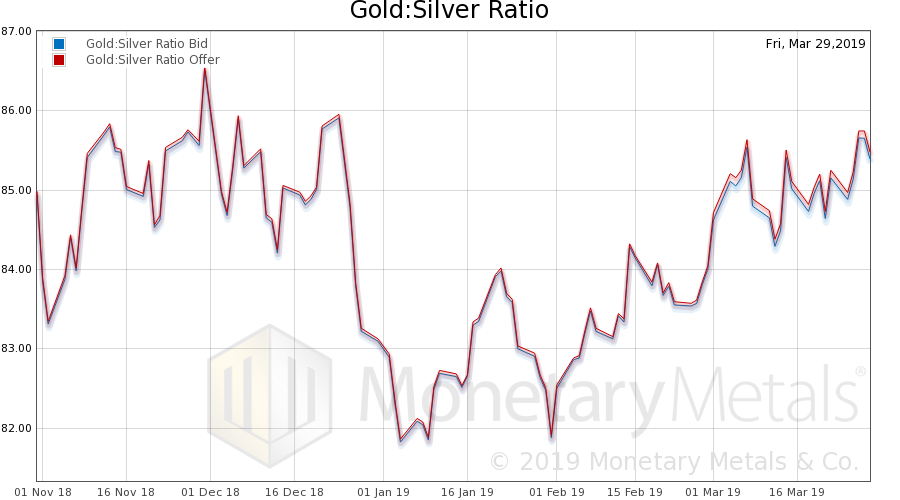 - Click to enlarge |
Gold Basis and Co-basis and the Dollar PriceHere is the gold graph showing gold basis, cobasis and the price of the dollar in terms of gold price. The scarcity (i.e. cobasis) increased a little bit, as the dollar rose. So the selloff was (mostly) futures. The Monetary Metals Gold Fundamental Price subsided $5 to $1,507. |
Gold Basis and Co-basis and the Dollar Price(see more posts on dollar price, gold basis, Gold co-basis, ) - Click to enlarge |
Silver Basis and Co-basis and the Dollar PriceNow let’s look at silver. Look at that spike in the cobasis. The May contract is in backwardation (cobasis > 0). This is what we call temporary backwardation, a term we coined to refer to the pathology that many contracts go into backwardation as they head into expiry. The silver basis continuous does not show the same exuberance, being up only a little. And the Monetary Metals Silver Fundamental Price was up 30 cents to $16.29. |
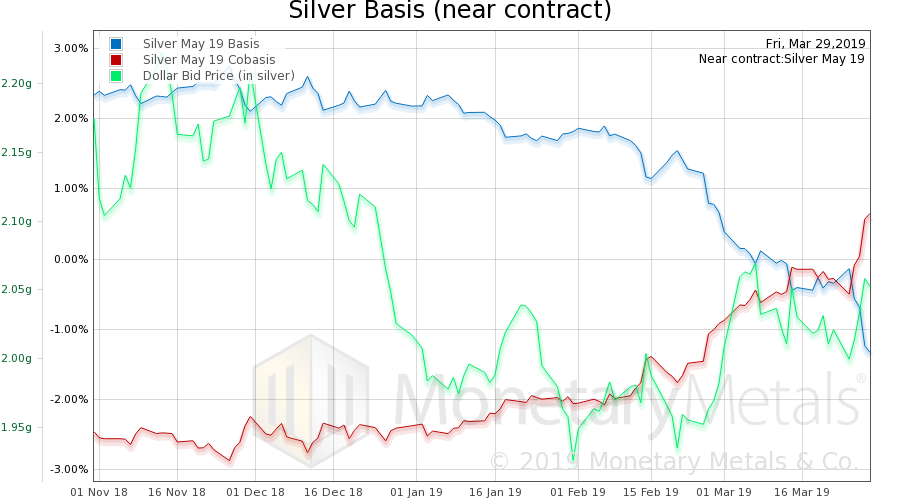 . |
© 2019 Monetary Metals
Full story here Are you the author?Tags: Basic Reports,dollar price,gold basis,Gold co-basis,gold price,gold silver ratio,newsletter,silver price


