Gold, in my worldview, can be a “heads I win, tails you lose” proposition. If it goes up, that’s fear. Nothing good. If it goes down, that’s collateral. In many ways, worse. Either way, it is only bad, right?
Not always. There are times when rising gold signals inflation, more properly reflation perceptions. Determining which is which is the real challenge. Corroboration and consistency are paramount.
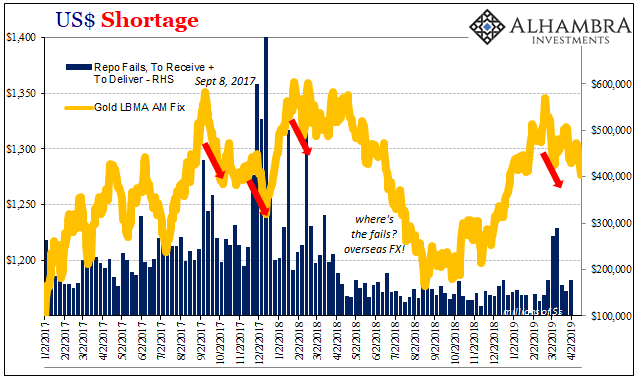
| Gold had been rising in impressively steady fashion since the second week in October. During that time, pretty much everything had been in disarray. The more reasonable assumption was fear gold rather than reflation. No green shoots here.
Then, abruptly in February, gold stops. The week following that local peak near $1350, FRBNY reported a noticeable increase in repo fails (shown below). By recent history, it wasn’t huge nor really all that much. Given the deluge of T-bills, an overabundance of supply since early last year, however, any increase in fails would be significant. The precious metal has been lower ever since. Not only down, but we’ve witnessed more early morning gold “pukes” along the way (there was one today). Pretty safe to say…collateral. I wrote elsewhere last week:
If there is list detailing artificial bids for UST’s, then collateral is at the very top of it. It would further make sense that as repo fails rise, gold falls, that illiquidity would spread and signal other forms of heavy UST bidding. General liquidity hedges, for one. |
US Shortage, Gold, 2017-2019 |
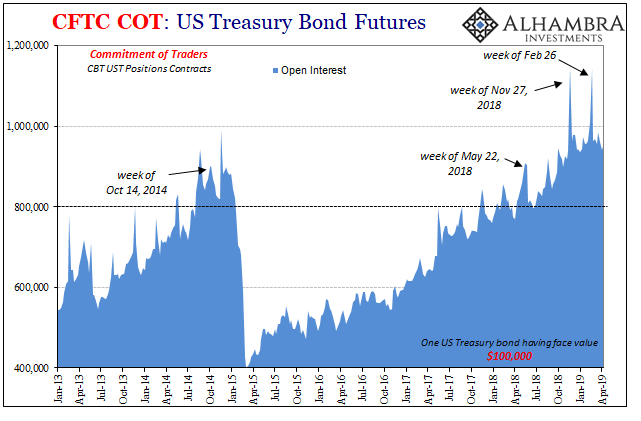
| The CFTC tells us that open interest in UST futures spiked in that very same timeframe. Open interest should be among the more uninteresting factors for any futures market, but in UST futures the history is very clear. When market participants are most interested in these instruments it usually amounts to bad things happening – or about to happen.
Since late February, while gold keeps dropping, though repo fails have returned to recent normal, open interest continues to be hot. At still 950k contracts last week (the latest data), the market continues hedging “something.” |
US Treasury Bond Futures, 2013-2019(see more posts on US Treasury, ) |
| Though UST yields have retraced from their late March lows, they haven’t really gone backward all that much. The stock market in the US is reaching new record highs on the prospects for either green shoots or more punchbowl, or both, bond market investors don’t seem to be nearly so sanguine.
This would include the net overall position. Having dumped from a relatively strong net long (meaning short bonds) the last week of November (coincident to the first jump in open interest), the futures market has moved pretty solidly the other way ever since. The week of February 26, the net position changed from slightly long (+2.7k) to the biggest negative in years (-23.9k). |
US Treasury Bond Futures, 2016-2019(see more posts on US Treasury, ) |
| The level was surpassed two weeks later (-32.5k) as curves crashed. As of last week, it is still -20.7k.
In other words, while in the mainstream optimism runs amok among dovish and greenish narratives there isn’t anything like that in the bond market. Collateral would be a big reason why. Collateral flexibility and availability has been among the biggest and most persistent of funding issues these last eleven years (hello Deutsche Bank). It certainly was that way last year just before April and May. It even showed up that way in EFF. Seems to be showing again in the same places at almost the same times this year, too. |
Money Markets Equivalents 2014-2019 |
Tags: Bonds,collateral,commodities,COT,currencies,economy,EFF,EuroDollar,Federal Reserve/Monetary Policy,Gold,Liquidity,Markets,newsletter,repo,repo fails,U.S. Treasuries,US Treasury,Yield Curve


