Keith Weiner
My articles My offerMy siteAbout meMy videosMy books
Follow on:LinkedINTwitterSeeking AlphaFacebookAmazonGoogle +
Hammering the SpreadThe price of gold fell nine bucks last week. However, the price of silver shot up 33 cents. Our central planners of credit (i.e., the Fed) raised short-term interest rates, and threatened to do it again in December. Meanwhile, the stock market continues to act as if investors do not understand the concepts of marginal debtor, zombie corporation, and net present value. People believe that the Fed must fight inflation, hiking rates to prevent overheating. Maybe. What the Fed is in fact doing is pushing the yield curve towards inversion. It’s not there yet, but right now the 3-month Treasury yield is 2.22%, while the 10-year yields 3.06%. Here is a graph of the spread between the 2- and 10-year. |
Fed New Guy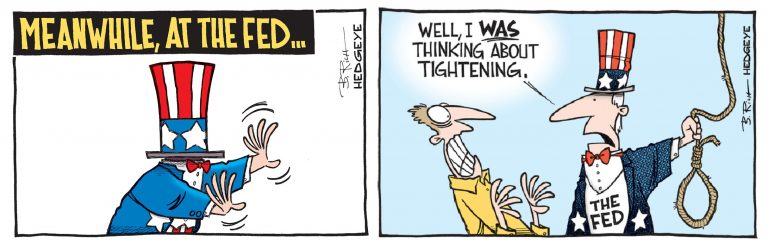 The Federal Reserve – carefully inching forward to Bustville - Click to enlarge |
| In 2014, before the Fed had hinted at hiking rates, the spread was over 250 basis points (i.e., 2.5%). As we recall, the first hints were around July 2015. And the first hike was in December 2015. By that time, the spread had compressed to half— 124bps.
Now, it is down below 1/10, a scant 27 bps. Mr. Fed Rate Hike, meet Dr. Falling Interest Rate Trend. He will take care of you, take care of you real good… |
US Yield Curve, Nov 2012 - Oct 2018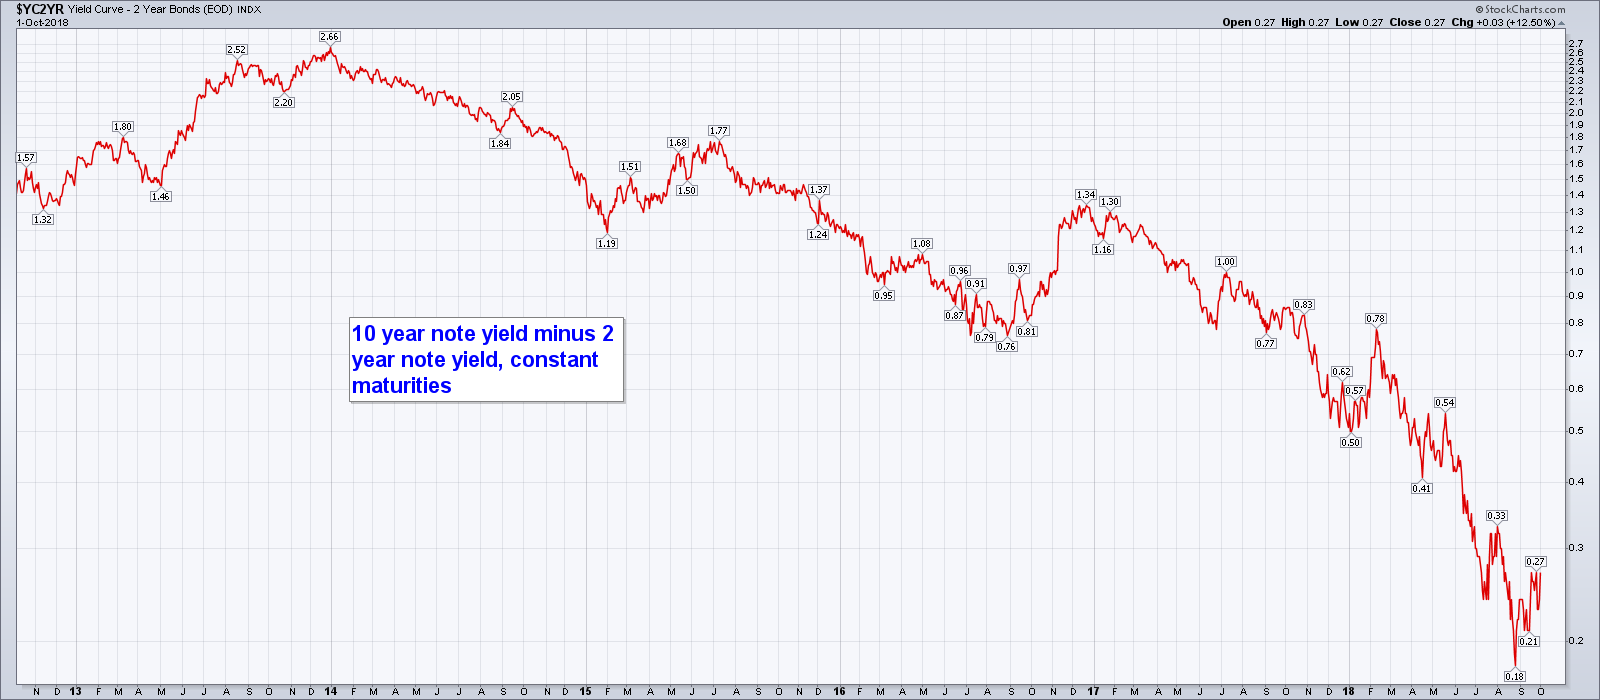 10-year note minus 2-year note yield spread as a proxy for the steepness of the yield curve. Note: coming out of a zero interest rate regime, a yield curve inversion is not required prior to a recession and therefore may never happen (Japan had five recessions since 1989 that were not preceded by a full yield curve inversion). However, the yield curve will still flatten ahead of an economic bust and widen steeply just as the bust is about to begin. Major lows in gold prices often coincide with an extremely flat or inverted yield curve. [PT] - Click to enlarge |
Fundamental DevelopmentsWe will look at the supply and demand fundamentals of both metals. But, first, here is the chart of the prices of gold and silver. |
Gold and Silver Price(see more posts on gold price, silver price, )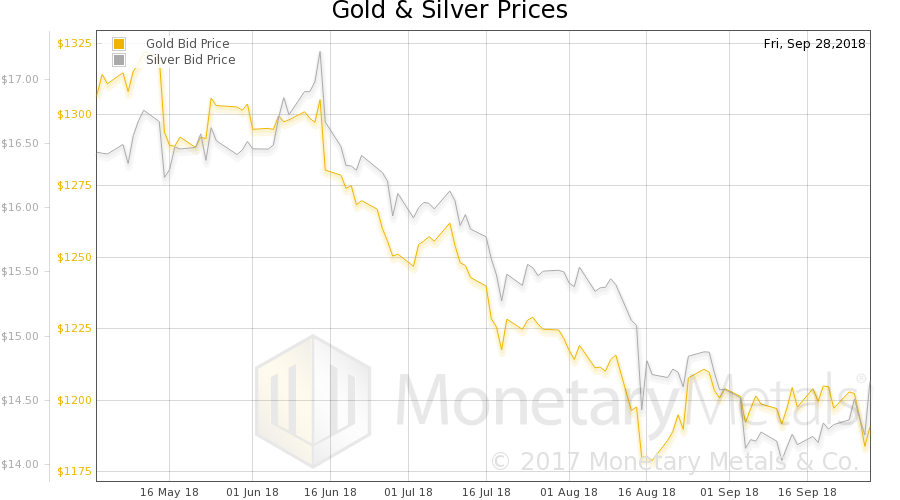 Gold and silver priced in USD - Click to enlarge |
Gold:Silver RatioNext, this is a graph of the gold price measured in silver, otherwise known as the gold to silver ratio (see here for an explanation of bid and offer prices for the ratio). It fell dramatically this week; especially on Friday. |
Gold:Silver Ratio(see more posts on gold silver ratio, )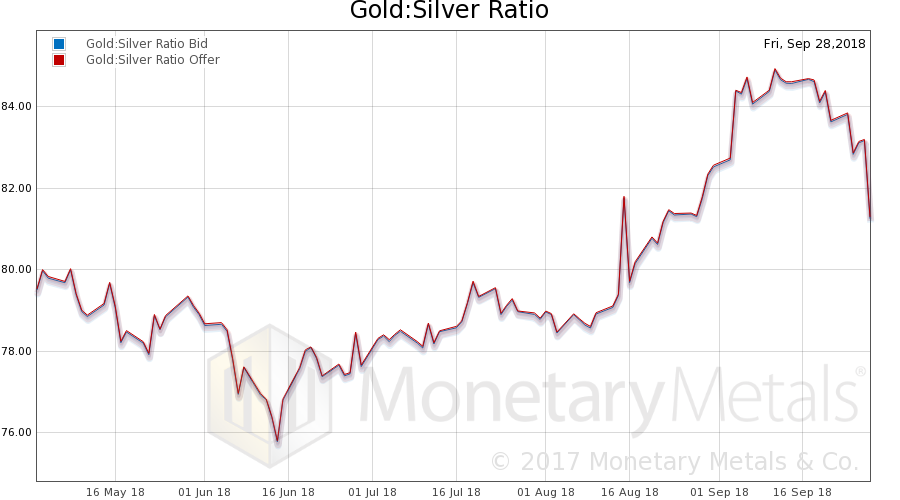 Gold-silver ratio - Click to enlarge |
Gold Basis and Co-basis and the Dollar PriceHere is the gold graph showing gold basis, co-basis and the price of the dollar in terms of gold price. The price of gold is down a bit (shown here as a rise in the dollar, measured in gold), and the scarcity of gold is up a bit. The Monetary Metals Gold Fundamental Price fell $6 to $1,352. But the action was not in gold last week. |
Gold Basis and Co-basis and the Dollar Price(see more posts on dollar price, gold basis, Gold co-basis, ) Gold basis, co-basis and the USD priced in milligrams of gold - Click to enlarge |
Silver Basis and Co-basis and the Dollar PriceSo let’s look at silver. In silver, the price rose and the co-basis fell. The Monetary Metals Silver Fundamental Price fell 11 cents to $15.83. We hear many anecdotes of a pickup of retail silver product sales, but the data so far show this is mostly a repositioning of speculators — to get the market price closer to where it would be based on fundamentals. |
Silver Basis and Co-basis and the Dollar Price(see more posts on dollar price, silver basis, Silver co-basis, )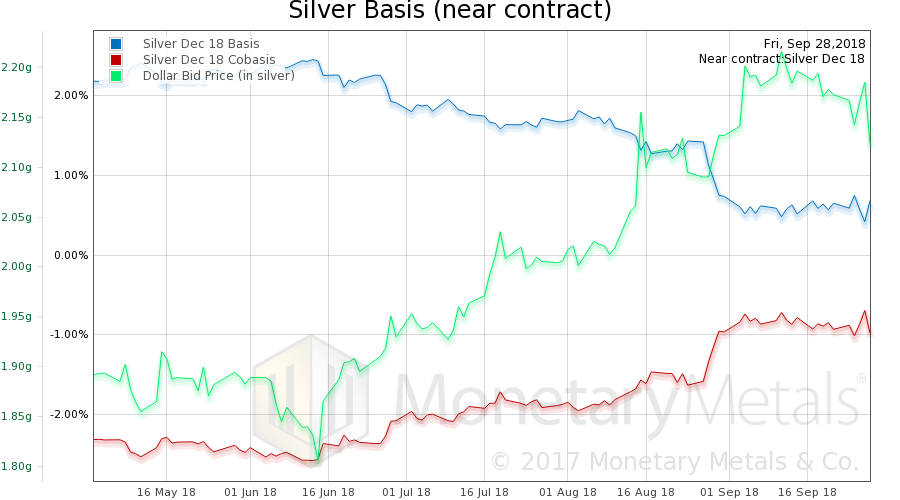 Silver basis, co-basis and the USD priced in grams of silver - Click to enlarge |
Charts by stockcharts, Monetary Metals
Chart and image captions by PT
Full story here Are you the author?Tags: Chart Update,dollar price,gold basis,Gold co-basis,gold price,gold silver ratio,newsletter,Precious Metals,silver basis,Silver co-basis,silver price