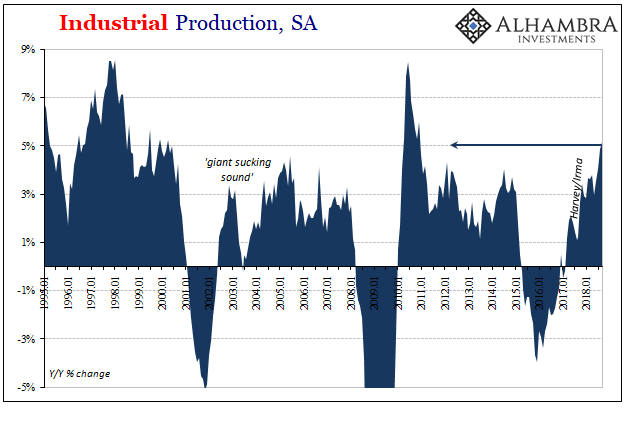
| The calendar last month hadn’t yet run out on US Industrial Production as it had for US Retail Sales. The hurricane interruption of 2017 for industry unlike consumer spending extended into last September. Therefore, the base comparison for 2018 is against that artificial low. As such, US IP rose by 5.1% year-over-year last month. That’s the largest gain since 2010.
While that may be, over the last five months American industry has slowed precipitously from its prior pace. It doesn’t show up because the annual rate of change is so heavily frontloaded by the aftermath of Harvey and Irma. Include within that the bringing forward of industrial (largely manufacturing) activity in anticipation of global trade restrictions, it created a period (8 months) where in isolation it looked like economic acceleration – to those who really wanted it to be. |
Industrial Production, SA 1995-2018 |
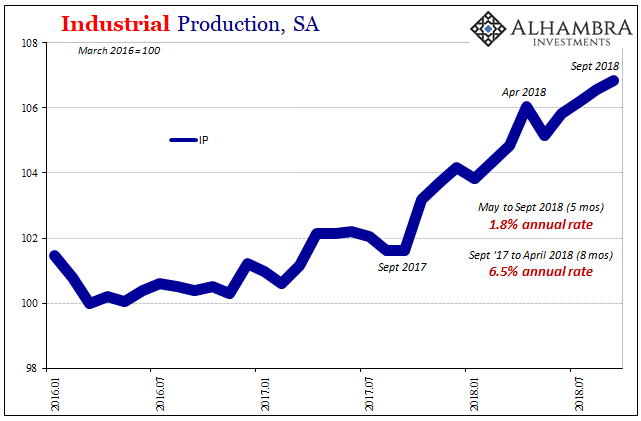
| In terms of Industrial Production, from October 2017 to April 2018 (inclusive) the total increase was 4.3%. By itself, that was more than in any month since 2010 at annualized rates. Annualizing those 8 months, it was as if US IP was growing at better than 6.5% which would have been something like the immediate aftermath of the Great “Recession.”
Over the last five months, however, IP has slowed considerably, rising by about three-quarters of a percent. That’s just 1.8% annualized, meaning growth more like the 2012 slowdown than the 2010 recovery(ish) trend. If this slowing continues throughout October, IP will have gained only 3.7% next month (down sharply from this month on base effects) since it will be compared to October 2017 and that month’s big jump kickstarting the storm cleanup effort. |
Industrial Production, SA 2016-2018 |
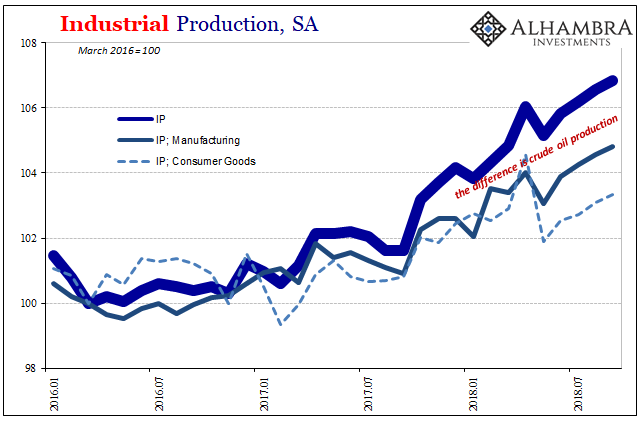
| All these annuals include acceleration in the mining sector, specifically crude oil. Crude production has slowed in the last two months, too, but that’s from an already blistering pace. If the reduction in growth this summer is indicative of anything more than temporary factors, US industry will lose the only segment that is consistent with rhetoric about this “strong” economy. |
Industrial Production, SA 2016-2018 |
| Manufacturing is up 3.9% compared to the 5.1% overall in September, while the manufacture of consumer goods has increased by just 2.5% year-over-year. Without the contribution from the oil patch, IP would be looking very different even including the tropical contributions. |
Industrial Production, NSA 2006-2018 |
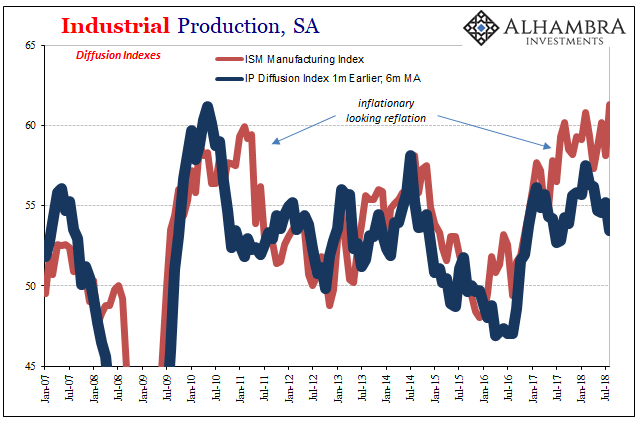
| Unlike sentiment indicators such as the ISM Manufacturing PMI, the Federal Reserve estimates that order activity is on the wane, too. Its diffusion indices have dropped back down now that those other artificial intrusions have cleared out.
The average in this latter indication was in September the lowest since, unsurprisingly, August 2017 just prior to Harvey’s destructive arrival. This is in sharp contrast to other more prominent sentiment indicators like the ISM which suggest renewed acceleration uncorroborated by so-called hard data (including the last five months of IP). |
Industrial Production, SA 2007-2018 |
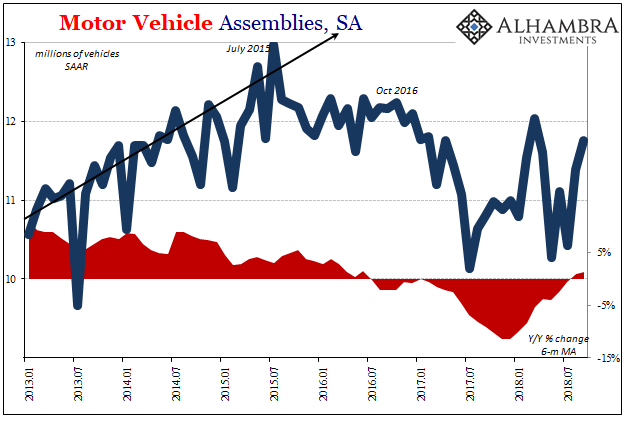
| As has been the case for the last three years, already spilling over into a fourth, it’s the auto market that is holding the manufacturing sector back. Motor Vehicle Assemblies rose to 11.75 million (SAAR) in September, but that remains substantially less than the peak back in 2015 and further behind what would’ve been a consistent growth trend had it not been interrupted by the “rising dollar.” |
Motor Vehicle Assemblies, SA 2013-2018 |
| Domestic auto production has yet to catch up to December 2016 when the industry was sent spiraling into cutbacks of the scale we’ve seen in past recessions (notably 2001). And that was more than a year and a half ago, meaning that there is as yet still no rebound in production outside of the automotive destruction in and around Houston last year.
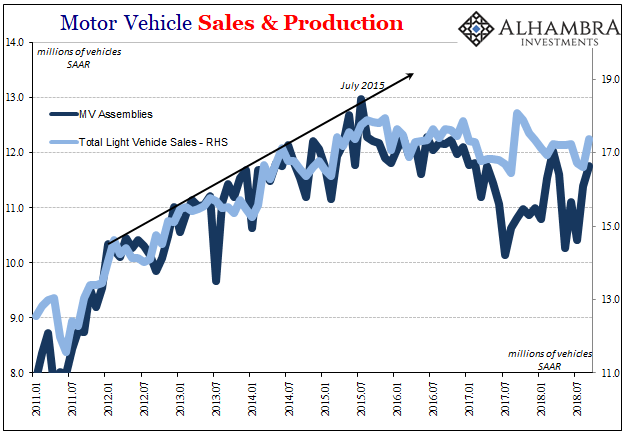
The reason is pretty simple, meaning auto sales. The trend continues to be slightly lower despite the unemployment rate. The two are supposed to correspond directly not inversely. The 2015-16 downturn produced a slowdown in the labor market not picked up by the unemployment rate even though the latter is the most widely cited statistic for the “strong” economy of 2018. Three plus years is more than enough time for that boom to show up if it was ever going to. |
Motor Vehicle Sales & Production 2011-2018 |
It is, or it was, the perfect storm for hysteria. While inflation hysteria has largely disappeared, the idea of a boom still sticks. The mining sector helping to hide persistent auto weakness therefore consumer reluctance, the whole further boosted by transitory factors related to weather and politics rather than money and economy. Next month it won’t be so easy, unless, of course, the economy actually picks up materially.
With what’s going on throughout the rest of the world, what are the chances of that? The calendar has probably already run out on the boom.
Tags: Auto Sales,base effects,consumer goods,Crude Oil,currencies,downturn,economy,EuroDollar,Federal Reserve/Monetary Policy,harvey,hurricanes,industrial production,irma,manufacturing,Markets,Mining,Motor Vehicle Assemblies,newsletter,U.S. ISM Manufacturing PMI


