Jeffrey P. Snider
My articles My offerMy siteAbout meMy videosMy books
Follow on:LinkedINTwitterSeeking Alpha
In 1999, real GDP growth in the United States was 4.69% (Q4 over Q4). In 1998, it was 4.9989%. These were annual not quarterly rates, meaning that for two years straight GDP expanded by better than 4.5%. Individual quarters within those years obviously varied, but at the end of the day the economy was clearly booming.
It also helped that these particular two years followed two good ones before them. GDP growth in 1997 was 4.39% and 4.45% in 1996.
This week the US Bureau of Economic Analysis will report real GDP growth for Q2 2018. After another disappointing start to the year, just less than 2% in Q1, in all likelihood growth picked up last quarter. We don’t know by how much just yet, some are calling for around 3% while others, such as those in the White House, think it will be 5%.
Either way, we’ve seen this all before. It will be called a boom even though the pattern remains less than that of 2014 and nothing at all like 1998 and 1999. People should pay much closer attention to 2014 than continue to dream of the dot-com era that is in no way attainable under current conditions.
For those whose memories are transitory, there was not one but two quarters where real GDP growth pushed beyond 4.5% the last time around. In Q3 2014, it was better than 5% (though revised differently over the years). And also like now, those two booming quarters occurred while underneath negative pressures had already started to erode what little momentum there was during them.
Booming quarters clearly don’t make a boom. Despite those two, GDP growth for 2014 overall was a chilly 2.69%. The only thing that is ever transitory is these good numbers.
This time is different, they’ll say. Tax cuts and global synchronicity make it different. They said similar enough things last time, too. Only then it was QE3, European “stimulus”, and global growth with China leading. China did lead, of course, just in the wrong direction.
Like sentiment surveys, contrary to pre-crisis patterns these “good” quarters have tended to mark the top in each mini-cycle rather than the start of an economy becoming meaningfully better off; the end of each small upswing rather than the beginning of necessary but long absent big acceleration. They say no one rings the bell at the top, but 4.5% GDP has so far been a pretty good sign of just that.
| If there was 5.08% in Q3 2014 right on the cusp of the nasty parts of the “rising dollar”, there was also Q4 2011 in the teeth of the 2011 crisis. GDP in that particular quarter? A booming 4.48%. |
US GDP and PMI, Feb 2011 - Jul 2018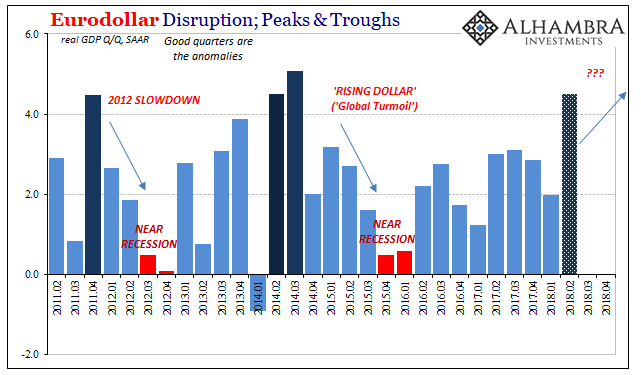 - Click to enlarge |
| Yet, after each of those the economy fell close to recession within about a year. Though both downturns were written about as if “unexpected”, when acknowledged at all, the signs were visible especially during these peak quarters.
They are on display yet again, having gone so far as to reach economic proportions already. Not merely financial alone, a slowdown gathers in key places like China and now Europe.
|
|
| They still call it “robust” even though it’s nothing of the sort. And they’ll keep calling it “strong” and “robust” until it hits a minus sign. Gradation matters quite a lot, especially after eleven years of monetary mud. |
Europe PMI and GDP, Jun 2012 - Jul 2018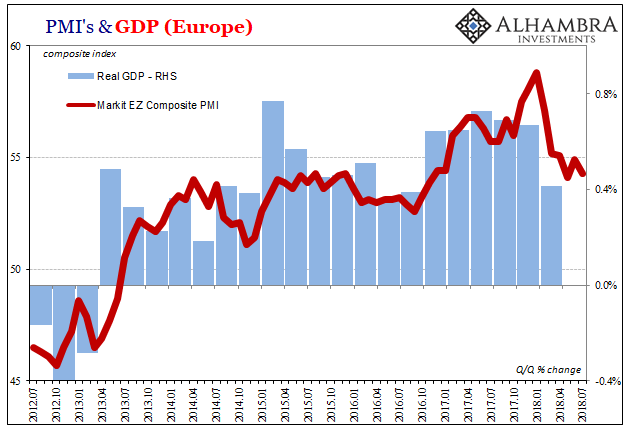 - Click to enlarge |
| It was hoped if not expected that IHS Markit’s flash composite PMI would continue its rebound from the “unexpected” drop and May’s recent low. Instead, there wasn’t much change in either June or July’s readings, suggesting a slowdown just might not be temporary. Europe’s economy which was described last year as booming when it wasn’t is now facing the prospect of being significantly less than even that low level – at best. |
Europe GDP QoQ, Jan 1995 - 2018 - Click to enlarge |
| The IHS Markit’s US composite PMI isn’t yet showing signs of this global slowdown, but that isn’t unprecedented. It failed to register the 2015-16 downturn until December 2015. |
US PMI, GDP and Composite PMI(see more posts on U.S. Gross Domestic Product, )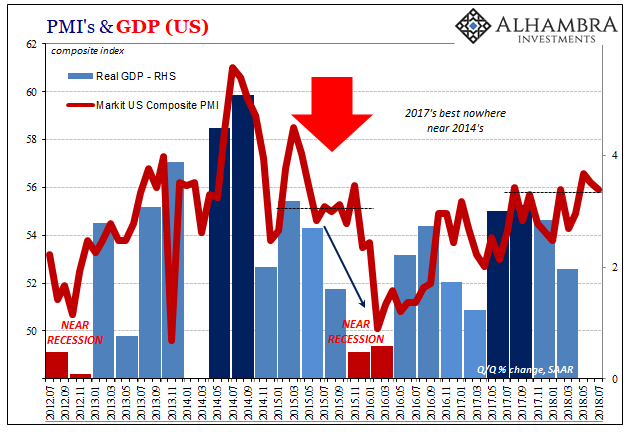 - Click to enlarge |
| If Q2 US GDP does end up better than 4%, it will be out of line with Markit’s numbers on the high side. That’s not necessarily surprising, either, given that trade war rhetoric has sped up a whole host of economic activity. However “good” Q2’s figure will turn out, there is every reason to suspect it is has borrowed substantially from Q3 and beyond before we even get to the eurodollar stuff. |
Money Markets, Jan 2009 - Jul 2018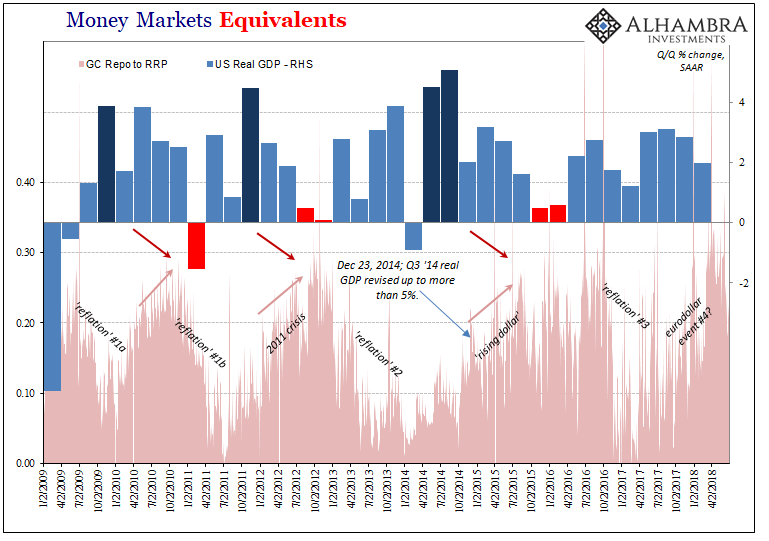 - Click to enlarge |
When the current occupant of the White House undoubtedly trumpets Friday’s number, he should at least pause before hitting publish on his tweet taking the time first to look back to December 2014 when the last occupant made the same mistake.
It was, as usual, a common theme. The New York Times:
The Washington Post:
Etc. They all confused one quarter, or two in 2014’s case, for something that it wasn’t. And it was pretty clear that it wasn’t. If the last lost decade has proven anything, you better watch out when you do get that booming one. Pop those champagne corks at your own peril. What really has mattered was hiding underneath in plain sight the whole time. |
Money Markets Repo, Feb 2009 - Jul 2018 - Click to enlarge |
Tags: balance sheet capacity,China,currencies,downturn,economy,EuroDollar,Europe,Federal Reserve/Monetary Policy,manufacturing,Markets,newslettersent,PMI,real GDP,repo,rising dollar,sentiment,U.S. Gross Domestic Product