This will be a fairly quick update as I just posted a Mid-Year Review yesterday that covers a lot of the same ground.
There were, as you’ll see below, some fairly positive reports since the last update but the markets are not responding to the better data. Markets seem to be more focused on the trade wars and the potential fallout. I would also note that at least some of the recent strength in the data is related to the tariffs. Tariffs are taxes and if they know a tax is scheduled to rise, people will find a way to accelerate the activity or product involved. So, yes, we’ll see a good print on Q2 GDP, but some of that – and I don’t know of any way to quantify it – is due to stockpiling of things like steel and aluminum ahead of the tariffs. Our exports of food accelerated recently because China ordered agricultural products before they imposed retaliatory tariffs. That isn’t economic growth that is sustainable or repeatable and the market knows it.
Economic ReportsEconomic Growth & Investment |
Economic Growth & Investment |
ProductionThe ISM surveys were better than expected but the details were somewhat less positive. The comments in both reports were quite strong in condemning and complaining about tariff effects. But the reports were strong and really the most common complaints were about trucking problems which is really a capacity problem. As I’ve said many times though, these reports are nothing more than a weathervane, a coincident indicator. They are always great right before they head south and they aren’t very good at calling tops in the business cycle. |
Production |
Consumption & DistributionCertainly no weakness here. Wholesale sales are up a whopping 11.8% year over year and are outstripping inventory builds (see below). Auto sales are back above the 17 million rate but what we see in auto sales is common with past cycles. Sales hit a peak and then go sideways until the recession. We’re in the sideways phase now and I have no idea how long that will last. |
Consumption & Distribution |
InventoriesWholesale inventories were up more than expected at 0.6% but not nearly enough to outstrip sales. Some of the inventory build may have been tariff related though. Did wholesalers stockpile some goods prior to the tariffs? Probably but there is no way to know how much. |
Inventories |
OrdersFactory orders were higher in May but not a lot of movement here. Durables were down 0.4% while non-durables were up on the back of higher energy prices. Capital goods orders were higher by 0.3% but last month was a lot better so it isn’t surprising to see some pullback. Overall, factory orders up 9.2% yoy is respectable but not spectacular. |
Orders |
TradeThe trade deficit has been narrowing recently although it is hard to say how much of that is real and how much is tariff related is hard to say. There has been a definite surge in exports and we know that some of that is energy and oil price related. Below you see exports plotted against WTI crude oil prices and the correlation is pretty obvious. |
Trade |
| There has also been a surge in food exports which appears to be driven by China imports ahead of their retaliatory tariffs. Lastly, we have seen a rise in capital goods exports too. It seems to me though that a lot of this “improved” trade deficit is about oil and oil prices.
Imports are up too but not as much and again there may be some oil related factors there. |
Balance of Peyments, Crude Oil Prices |
InflationAluminum and steel prices are on the rise at the producer level as the tariffs take effect. Energy prices were also up but that was offset by a drop in food prices for the less food and energy reading. Trade services which tracks prices at wholesalers were also up strong the last two months which maybe sheds some light on that wholesale sales figure. Consumer prices remain pretty well behaved but we’ll see if the pressure at the producer level feeds through in coming months. With the recent dollar strength I’m not too concerned about inflation at this point. More importantly the bond market apparently isn’t either. |
Inflation |
EmploymentThe employment picture hasn’t changed much. The unemployment rate did tick a little higher but for a good reason – people are re-entering the workforce. The JOLTS reports was a little mixed as openings declined – from a high level – but the quit rate is now up over 10% year over year. That shows a level of confidence in the employment market we haven’t seen in some time. We see no wage pressure here either; the weakest part of the report was hourly earnings and the workweek. If we had a really tight labor market both of those would be rising rapidly. |
Employment |
ConstructionStrength in construction is waning a tad but the residential portion is still fairly strong. Multi-family and single family construction were both positive while non-residential was down 0.3%. |
Construction |
SentimentSmall business optimism is still very strong but half the components of the report were actually down. We’re probably seeing a peak now. Consumer sentiment has cooled somewhat with current conditions lagging expectations. |
Sentiment |
Market Indicators10-Year Treasury Note YieldThe 10 year yield is still in the same range it has been in since February. Growth expectations in the bond market are a lot more subdued than the commentary coming from the Fed and most other economic commentators. With Q2 growth widely expected to show a surge it is interesting that bonds have not responded. So, who do you think will be right? The Fed or the market? I know which one I’d bet on. |
10-Year Treasury Note Yield |
10-Year TIPS YieldTIPS yields rose slightly since the last update but real growth expectations are still stuck where they’ve been since 2013. Until this breaks out I would not expect to see a surge in capital spending or a sustainable surge in growth. |
10-Year TIPS Yield |
2-Year Treasury YieldAs I pointed out in the last report, the 2 year yield seems to have stalled a bit although it did make a new high for the move this week before pulling back. The Fed may think it is going to hike two more times but this market is showing some doubt creeping in. |
2-Year Treasury Yield |
10/2 Yield CurveThe yield curve continues its relentless flattening. The Fed is desperately trying to find a reason to ignore this but it means what it means. Long term growth expectations are stuck at a low level and no amount of research claiming the term spread is negative is going to change that. |
10/2 Yield Curve |
Credit SpreadsCredit spreads improved a little since the last update as junk bonds rallied. There is no stress at all in junk land. |
Credit Spreads |
US DollarThe dollar index is trying to break out above that 95 level but hasn’t been able to do so decisively yet. Maybe it is just a matter of time as there are ample signs of tightness in the market for dollars. In addition, while speculators are long the index it isn’t a large imbalance. |
US Dollar |
CommoditiesThe stronger dollar has just killed gold as we’ve fallen through all support. Even long term momentum, which has remained bullish through this sell off, is nearing a sell signal. |
Gold Continuous Contract |
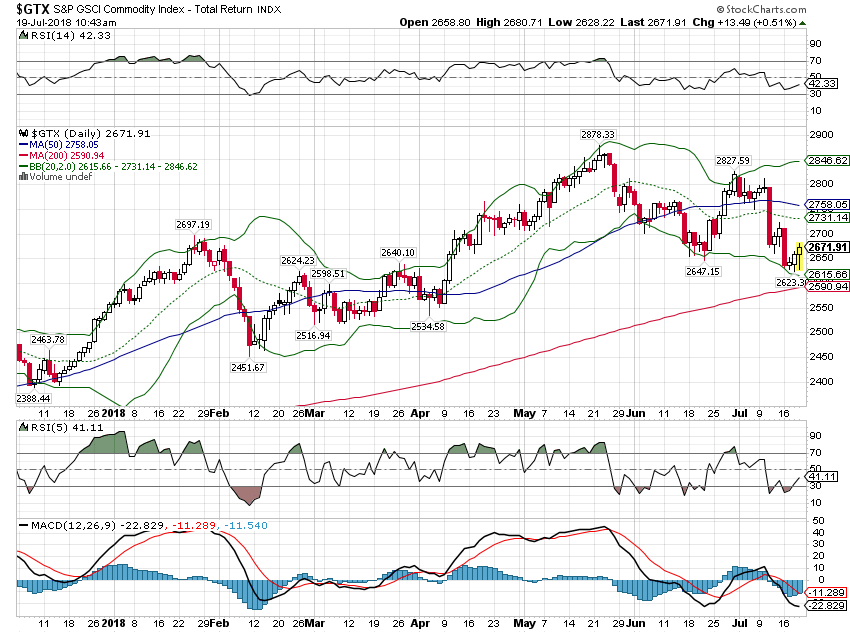
| The GSCI has performed much better than gold due to fairly firm oil prices. Will crude stay up? I don’t know but speculators are quite long while the smart money is on the short side. |
S&P GSCI Commodity Index |
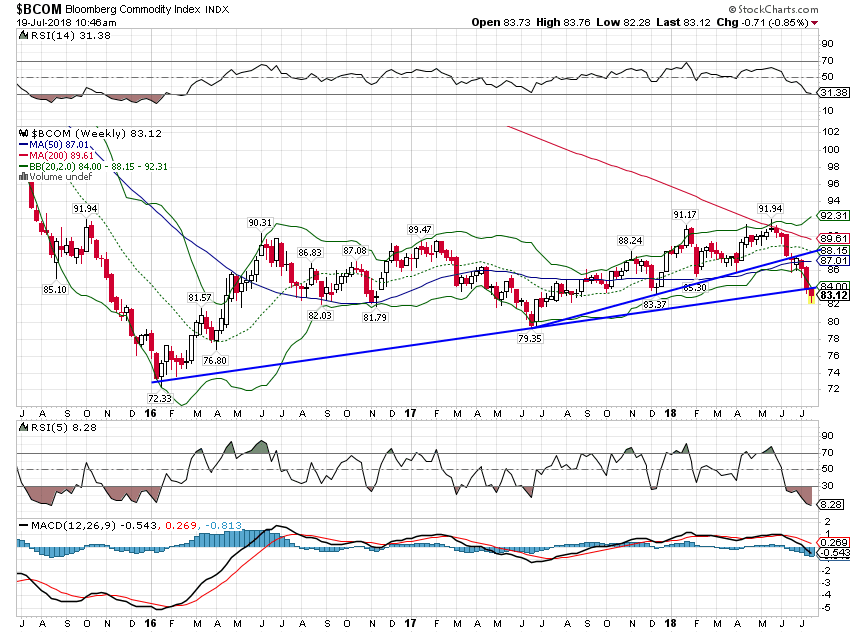
| The Bloomberg commodity index is nearing some support so you may get a bounce soon. Will it last? Questionable unless the dollar resumes its downtrend. |
Bloomberg Commoditty Index |
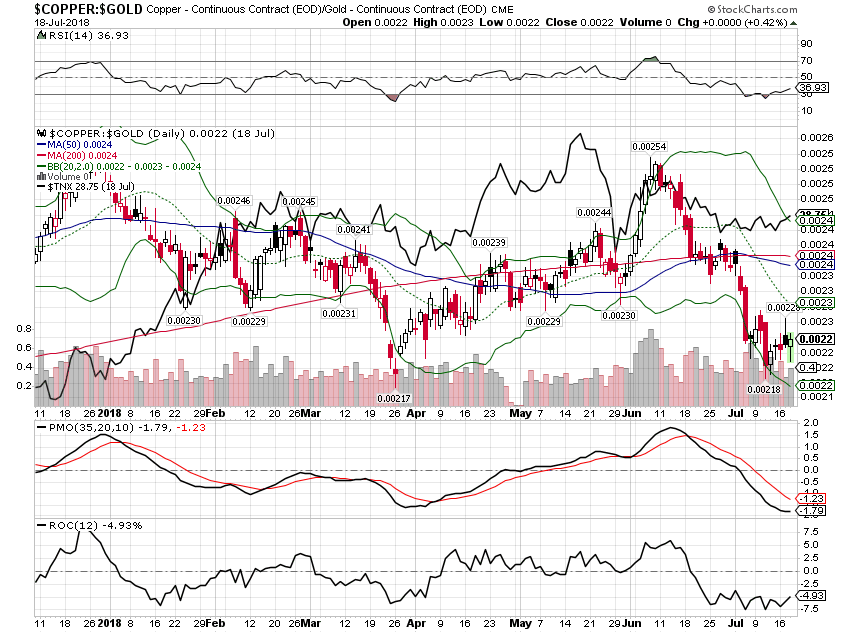
| As bad as gold has been, copper has been worse. This points to lower bond yields and is not a positive sign for growth. |
Copper Continuous Contract / Gold Continuous Contract |
I don’t think the growth or inflation outlook has changed all that much – yet. A rising dollar, falling commodities and a 10 year yield still stuck below 3% is not a comfortable combination though. That is not consistent with the boom narrative of the White House where Larry Kudlow seems to think we’re on the verge of persistent 4%+ growth. Q2 GDP will probably be a good number but extrapolating that into the future is not something the markets are willing to do at this point. Unless the administration produces the goods on trade pretty soon, this is going to start looking like the beginning of a recession. The yield curve is already pretty flat and the Eurodollar curve is inverted, future years at a lower yield than present. That is a warning sign and one that the White House and the Fed ought to heed.
But we aren’t there yet. Right now, the US economy is fine, growing a little above trend but slowing from the faster pace of Q2. If the President is as good a negotiator as he claims, maybe this will be just that – a slowdown that doesn’t amount to anything. The administration claims progress is being made in trade negotiations but the market is going to need something more concrete than an interview with Trump friendly Joe Kernan on CNBC.
Tags: Alhambra Research,Bi-Weekly Economic Review,Bonds,commodities,Construction,copper to gold ratio,credit spreads,currencies,economy,employment,exports,factory orders,imports,inflation,Interest rates,Inventories,Markets,newslettersent,oil prices,Politics,TIPS,trade deficit,US dollar,Yield Curve


