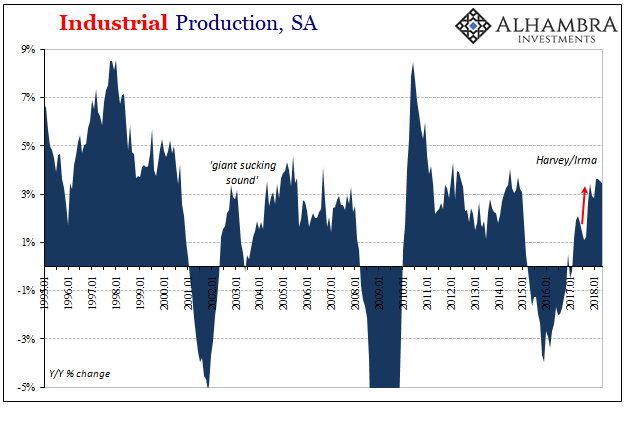
| US Industrial Production dipped in May 2018. It was the first monthly drop since January. Year-over-year, IP was up just 3.5% from May 2017, down from 3.6% in each of prior three months. The reason for the soft spot was that American industry is being pulled in different directions by the two most important sectors: crude oil and autos.
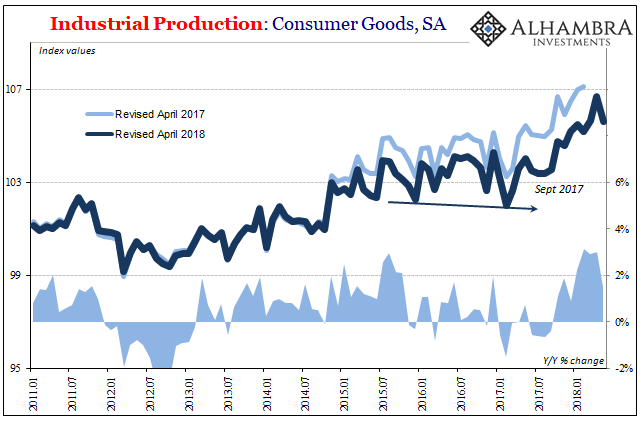
In the middle is the middling performance of manufacturing especially for consumer goods. Demonstrating the hurricane effect, IP for consumer goods was flat to slightly lower from July 2015 until September 2017. Those two years coincide with the downshift in the US labor market, and therefore the incomes for workers. In October last year, production rose for the first time but it only lasted for four months. |
U.S. Industrial Production, SA 1995-2018(see more posts on U.S. Industrial Production, ) |
| Production in this segment for the five months of 2018 through May is up just 0.4%. There is little to no meaningful growth here again. |
U.S. Industrial Production: Consumer Goods 2011-2018(see more posts on U.S. Industrial Production, ) |
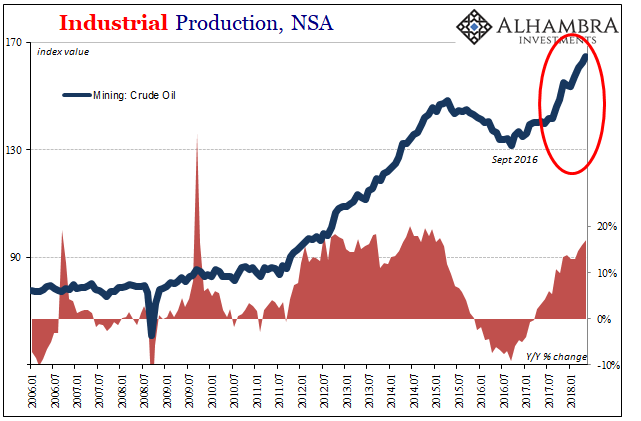
| To the plus side is mining specifically for crude oil. The US energy sector continues on with its rapid expansion. The opening of foreign markets to US exports of oil has propelled much of the current increase (it sure hasn’t been domestic demand; crude stocks remain elevated despite so much production now being diverted overseas). |
U.S. Industrial Production, NSA 2006-2018(see more posts on Crude Oil, U.S. Industrial Production, ) |
| After a two-and-a-half-year hiatus, production is back growing at the same level as during the initial shale boom 2012-14. In terms of IP, production was up 17% year-over-year in May following a 16% increase in April. The 6-month average has risen to 14%, the highest since early 2015.
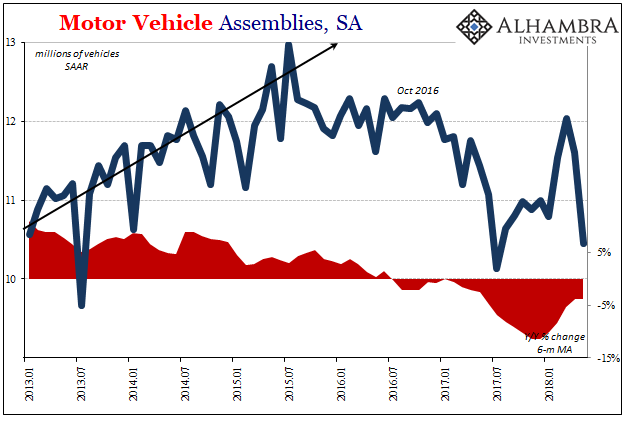
It’s not another hurricane effect, but it’s worth noting the timing of this latest acceleration. Oil production was growing, albeit at a much more cautious pace up until September 2017. Then, as if someone flipped a switch, the pace of pumping shifted to a whole other level. That coincides with a lot about inflation hysteria and the overall boom narrative incorporated within globally synchronized growth. The solid rise in oil prices as the futures curve switched out of contango to backwardation occurred at the same time. It was surely self-reinforcing (including, as noted before, the reduced hedging activity of producers still holding so much oil). Whether that boosted the growth narrative or whether it was a product of it can’t be dissected. At the far opposite end, whatever it was that possessed automakers in February and March of this year to raise domestic production from lows at the end of last year was totally erased in May. It never made much sense to me, though there were whispers of weather-related production problems specifically in January 2018. I doubt that was the case and certainly not to the extent that production would be halted to such a degree it would necessitate the big leap starting in February. |
Motor Vehicle Assemblies, SA 2013-2018 |
| I think it far more likely that car manufacturers were responding to the last vestiges of the hurricane effect (inventory rebalancing) combined with the fever pitch that inflation hysteria and the global boom story had reached by then.
As with how markets have treated recent inflation numbers, what a difference a few months makes. Over the past few months since that jump in production, there have been spreading currency problems as well as growing market uncertainty about a great many factors – starting with what might actually be the global economic condition. That US sales of autos have continued to sink back toward last year’s levels doesn’t help but reinforce negative impressions and worries. |
Motor Vehicle: Sales & Personal Income 2011-2018 |
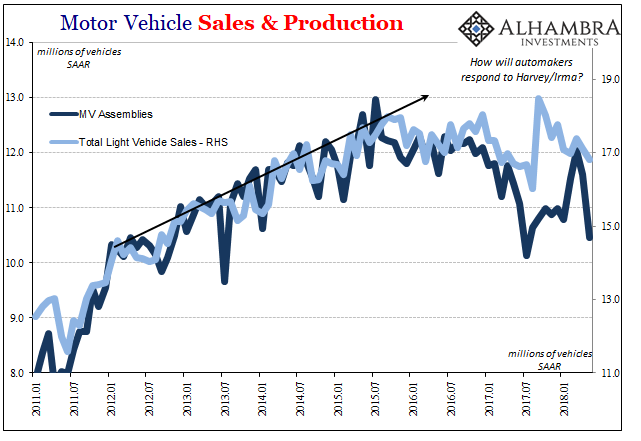
| Total Motor Vehicle Assemblies last month were thought to be just 10.45 million (SAAR). That’s an incredibly low level, the fewest assemblies since last July which came amidst mid-year shutdowns and model reorientation. In June 2013, for example, MVA’s came in at 11.2 million even though in the next month automakers would prolong their shutdowns (just 9.66 million in July 2013).
Out of all the economic statistics and of fundamental aspects, it is the auto sector that looks most like recession; but only the respect of substantial contraction. The time component for that decline, however, indicates something very different especially as there is a clear link between production and auto sales, and then between sales and the labor market via the drop-off in income. |
Motor Vehicle Sales & Personal Income 2010-2018 |
That would propose rather than being a product of cyclical changes, there is instead widespread underlying weakness that completely belies the boom. The auto sector may not be what it once was in terms of its economic proportions, but this is no niche market and these aren’t the conditions of just a run-of-the-mill slowdown.
In other words, if globally synchronized growth was a real thing, and its effects on the US economy were likewise more than rhetorical, then why hasn’t US income accelerated? Why haven’t Americans shaken off the effects of 2015-16 and started buying more cars again (especially cars, though sales of light trucks are no longer growing, either)? To be stuck in this position with, outside of weather events, a downside bias in sales and production for such a long stretch (closing in on three years) illustrates the opposite concepts from a boom.
But, depending on your disposition, you can take your pick. Is the “real” economic condition oil, or is it autos? These aren’t mutually exclusive choices, though even recognizing that fact suggests something wrong not everything right (which is what a boom looks like).
It’s now June 2018 and most of the data is updated through May 2018. If it was coming, it would have by now. Instead, there is way too much still going the wrong way. It’s at least enough doubt and direct contrary evidence to bury inflation hysteria, and maybe in some parts of the world to do more than that.
Tags: automobiles,consumer goods,consumer spending,Crude Oil,currencies,economy,Federal Reserve/Monetary Policy,income,industrial production,manufacturing,Markets,Mining,Motor Vehicle Assemblies,newslettersent,U.S. Industrial Production,vehicle sales


