Marc Chandler
My articles My offerMy siteAbout meMy videosMy books
Follow on:LinkedINTwitterSeeking AlphaAmazon
Summary:
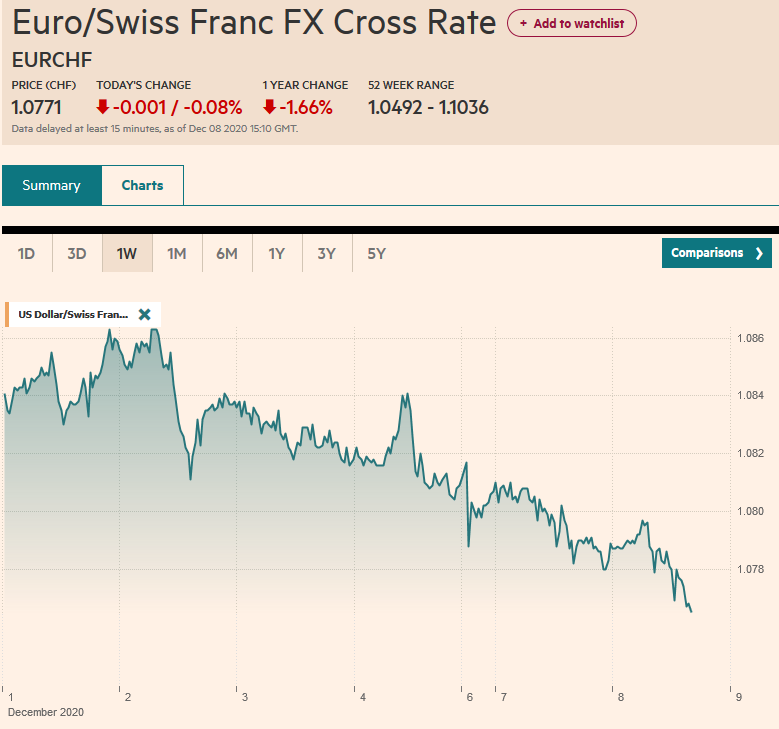
Euro has fallen 10.5 cents since mid-February.
Net speculative longs in the futures market remain near record.
Gross long euros have actually increased over the past month.
| When one trades futures, one declares whether one has an underlying business need, in which case one is considered a commercial. If no underlying business need exists, one is classified as a non-commercial, which in the vernacular of the market is a speculator.
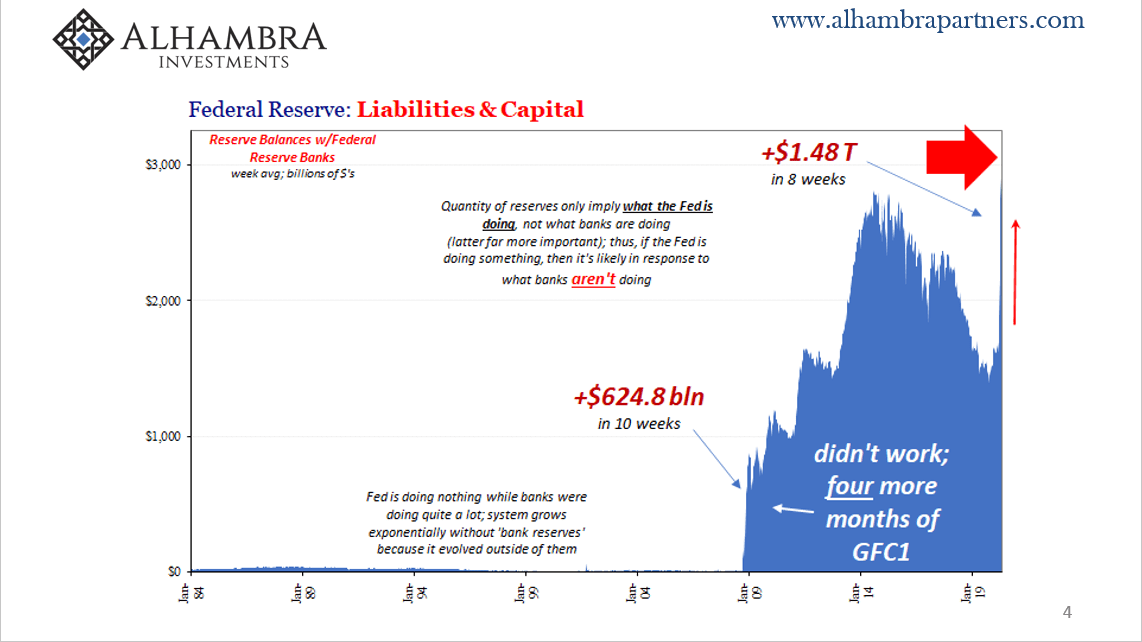
This first Great Graphic, created on Bloomberg, shows the net speculative euro position for the last five years. The net long position peaked in late April near 151.5k futures contracts. It has fallen for five weeks to 109.7k as of May 22. It is the smallest net long euro position since the end of last year. However, as the chart illustrates, except for the recent period, the net long speculative position remains large by historical standards. Traditionally, investors and analysts focused on the net position. However, the net position is the sum of gross long positions and gross short positions. If the euro sells-off, the pain is felt by the gross longs, not by the net position. Indeed, the including the gross shorts, the net position understates how the market exposure. |
Net Euro Longs - Click to enlarge |
| This second Great Graphic shows speculators’ gross long euro position. It peaked in late January near 262k contracts. As of May 1, it stood at 221.3k contracts, practically unchanged from April 3. Here in May, the euro bulls have added to the gross long position despite (or because) of the euro’s 3.5% slide. As of May 22, the gross long position stood at 226k contracts.
The take away is that the euro bulls have trimmed their exposure much less than one might have expected given the 10.5 cent decline since mid-February. In the fifteen weeks since the euro peaked, it has risen in only four weeks. Where the longs capitulate remains an open question. The euro closed below the mid-November low (~$1.1550) yesterday, but the euro bounced back to $1.1675 today. The next important chart point is near $1.1450, which corresponds to a 50% retracement of the euro’s rally that began early last year. The 61.8% retracement is found a little below $1.12. We also can anticipate another technical development. The dead man cross (also known as a golden cross) is when the 50-day moving average crosses below the 200-day moving average. Making some conservative assumptions, next week could see the dead man cross in the euro for the first time in a year. |
Euro Gross Long - Click to enlarge |
Full story here Are you the author?
Tags: $EUR,Commitment of Traders,Great Graphic,newslettersent