See the introduction and the video for the terms gold basis, co-basis, backwardation and contango.
Unfulfilled PropheciesThe price of gold fell $12 last week, but that of silver dropped 63 cents. What’s up with silver?! A prominent analyst wrote on April 19 of the “breakout” in silver. Of course, without the benefit of the basis and the Monetary Metals fundamental price, he could only see the price chart, plus the regular Wall Street indicators such interest rates, oil, and inflation. Based only on those indicators, and blind to the fundamentals, he top-ticked the price of silver almost perfectly. The price hit a high of $17.36 that day, and since then it’s all been downhill, through Friday’s close 89 cents below when he called for the price to take off.
The week before, we said:
|
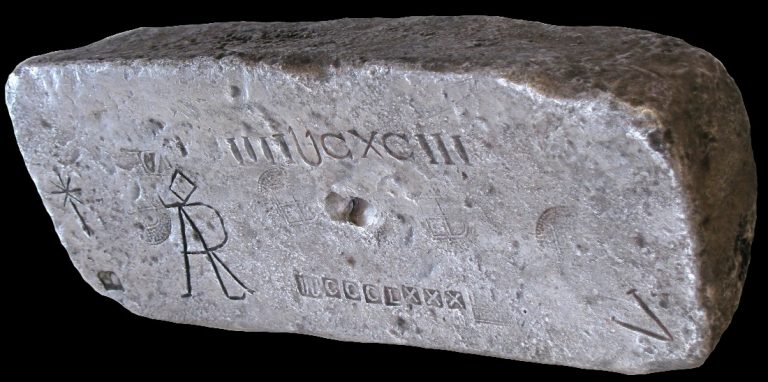 A somewhat unsightly silver bar of historical interest, found in 1985 in the holds of the wreck of the Spanish galleon Nuestra Senora de Atocha, which sank near the Florida Keys in 1622. - Click to enlarge It was laden with silver the conquistadores had reportedly just stolen fair and square from Potosi in Bolivia. One presumes the perennially teetering on the verge of bankruptcy Spanish Crown was not very amused (34 of the bars belonged to the King outright, and he would have collected a 20% tax on the rest to boot). Anyway, lumps like this one don’t do breakouts; they do brick-outs and will hurt your toes if you’re not careful. [PT] |
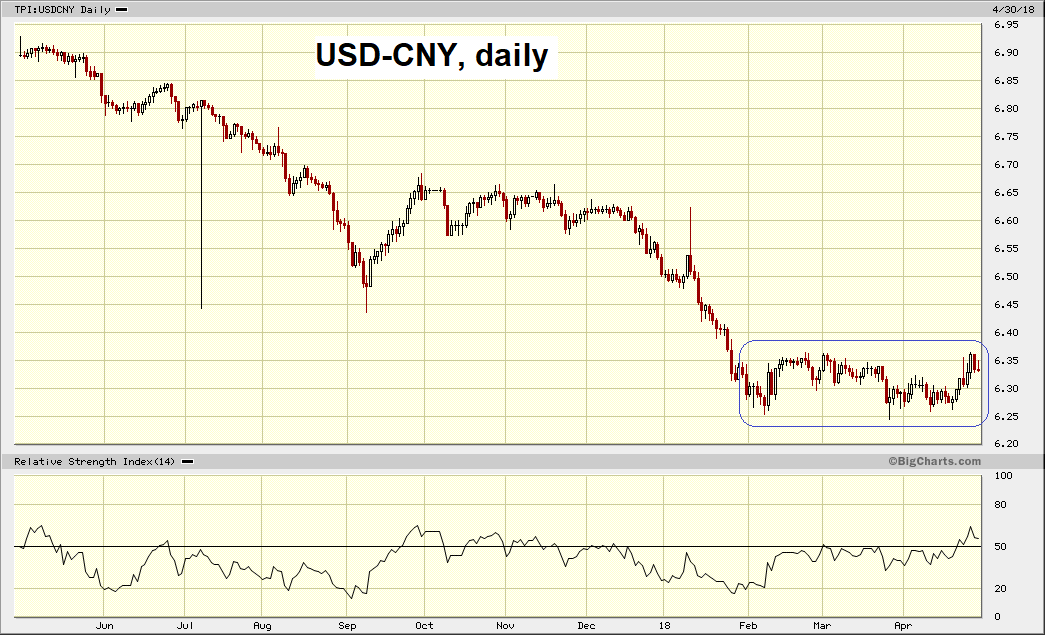
USD/CNYThe putative replacement for the petrodollar, the petro-yuan, has been sagging since the last date given by some gold bugs for the collapse of the dollar (that collapse, by the way, has been re-scheduled for this summer sometime when the “IMF will alter financial laws”), in case you’re keeping a calendar of such predictions). We remain firm to our idea that any oil producer who wanted gold, could have been selling oil futures and buying gold futures for 40 years In New York. This trade has long been possible, so instead of looking for a new market that offers it, we should look for an explanation of why the oil producers don’t want to sell their oil for gold (I will discuss reasons why they would want to do it in his talk at the Harvard Club). |
USD/CNY, daily |
Fundamental Developments – Fundamental Gold Price Remains FirmWe will look at the picture of silver fundamentals and discuss the prognosis below. But first, here is the chart of the prices of gold and silver. |
Gold and Silver Prices(see more posts on gold price, silver price, ) |
Gold:Silver RatioNext, this is a graph of the gold price measured in silver, otherwise known as the gold to silver ratio (see here for an explanation of bid and offer prices for the ratio). Big rise in the ratio. |
Gold:Silver Ratio(see more posts on gold silver ratio, )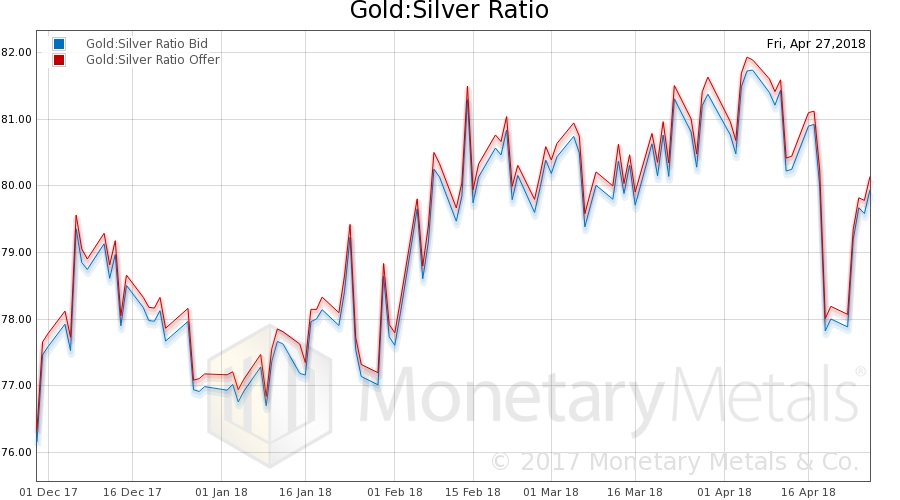 Gold-silver ratio, bid and offer. A rising gold-silver ratio is traditionally considered to signal decreasing economic confidence, based on the idea that the industrial demand component is far important for silver prices than for the price of gold, which is driven almost exclusively by investment demand. [PT] - Click to enlarge |
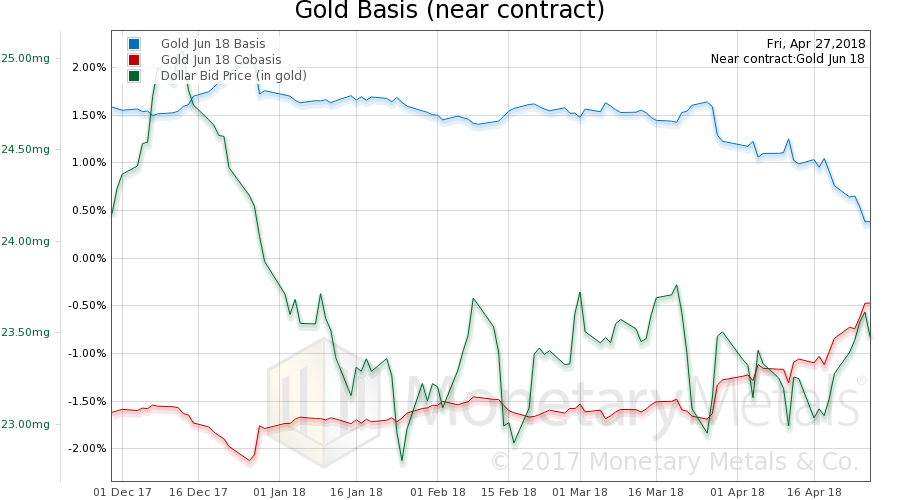
Gold Basis and Co-basis and Dollar PriceHere is the gold graph showing gold basis, co-basis and the price of the dollar in terms of gold price. The market price of gold fell, but scarcity i.e., the co-basis (red line) rose. The Monetary Metals Gold Fundamental Price rose $31 this week to $1,538. |
Gold Basis and Co-basis and the Dollar price(see more posts on dollar price, gold basis, Gold co-basis, ) |
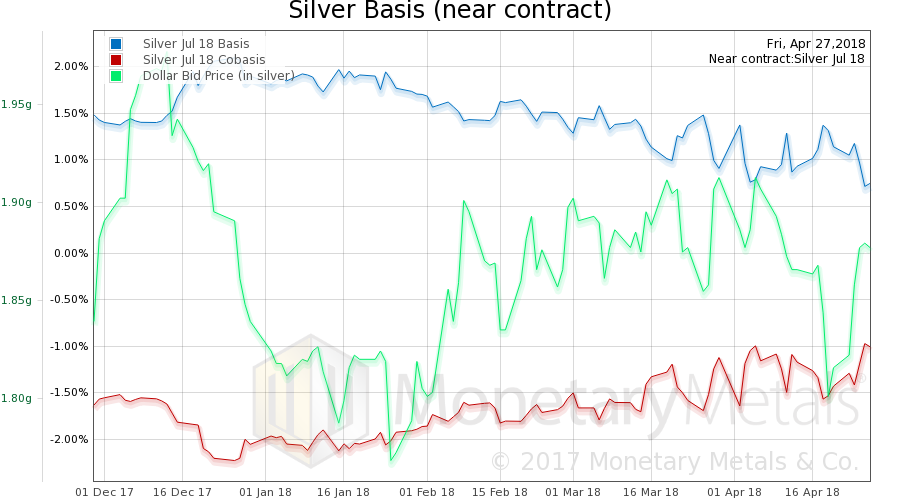
Silver Basis and Co-basis and Dollar PriceNow let’s look at silver. In silver, the pattern this week was the same as in gold. Scarcity increased a bit as the price fell. However, the price of silver fell considerably more than the price of gold. Perhaps the selling last week was liquidations of those who bought metal in the previous week? |
Silver Basis and Co-basis and the Dollar Price(see more posts on dollar price, silver basis, Silver co-basis, ) |
The Monetary Metals Silver Fundamental Price fell 28 cents to $17.49.
With that drop, the fundamental price of silver is back in the sideways range it has occupied since at least June last year. And arguably since July 2016.
One can argue over whether the price of silver “should” react to China, interest rates, unemployment (record lows, we hear, if you don’t count 96 million people in the workforce), etc. However, this reaction will be a self-fulfilling prophecy of futures traders all trying to front-run the rush to buy the metal that they imagine “should” occur. And they will be front-running only themselves.
What we can’t argue — no, this is not technical analysis, GATA — is that a shift to sustained buying of real metal will be pulling metal out of warehouses. Which is the opposite of the current trade. The continuous silver basis is about 2%. Thus it makes sense for traders to buy the metal and sell it forward, to pocket 2% annualized (net of bid-ask spreads, but not including trading commissions).
Another way to look at this is that buying of real metal will push up the offer price on spot. Remember: basis = future(bid) – spot(offer)
Buying of real metal will cause a drop in the basis. For whatever reason, or reasons, there is a high basis right now. Could the price rally on futures exuberance only? Sure it could. How far could it rally? In past few years, we recall a market price up to three bucks above the fundamental price. So to twenty bucks or so.
How long could it hold? It can hold longer than you can stay solvent shorting it (to paraphrase one of our least favorite economists). But one does not bet that the price of something will move against its fundamentals.
NB: the fundamental price is currently above the market price. So you could bet on a rising market price to a point. The above discussion was about the possibility of a breakout, which we assume no one thinks means moving up a dollar to $17.50.
© 2018 Monetary Metals
Charts by: BigCharts, Monetary Metals
Chart and image captions by PT
Full story here Are you the author? Previous post See more for Next postTags: Chart Update,dollar price,Gold,gold basis,Gold co-basis,gold price,gold silver ratio,newslettersent,Precious Metals,silver,silver basis,Silver co-basis,silver price


