See the introduction and the video for the terms gold basis, co-basis, backwardation and contango.
Object of SpeculationThe prices of the metals fell last week, $22 and $0.24 respectively. It’s an odd thing, isn’t it? Each group of traders knows how gold “should” react to a particular type of news. But they all want the same thing — they want gold to go up. And when it doesn’t, many hesitate to buy. Or even sell. This is why speculation cannot set a stable price (I’m talking to you, bitcoiners). So long as gold’s sole purpose is to bet on its price to make real money — we’re talking dollars here, baby! — then the trading action is like a giant Ouija Board, with each group having a thumb on it. You have the Indian jewelry buyers, the inscrutable central banks like the PBoC, the Wall Street firms, the gold bugs, the hedge funds, etc. When enough of those thumbs desire to push gold in the up direction, it goes up. Of course this isn’t gold’s purpose, but that’s what is commonly believed. It is endlessly fascinating as it is endlessly moving around, if not in the directions and for the reasons that gold analysts think. This is the dynamic we study, the interplay between buys and sellers of real metal, buyers and sellers of futures, and market makers. Many gold analysts see only the short futures position of the market makers, and conclude that they are pushing the price down. The long metal (or gold receivable, e.g. from a miner) is not reported in the Commitment of Traders report). So they misread the market. Plus, a quantity approach to position size (as with quantity of dollars or anything else) does not tell you much. |
|
Fundamental DevelopmentsLet’s take a look at the only true picture of the supply and demand fundamentals for the metals. But first, here is the chart of the prices of gold and silver. |
Gold and Silver Price(see more posts on gold price, silver price, ) |
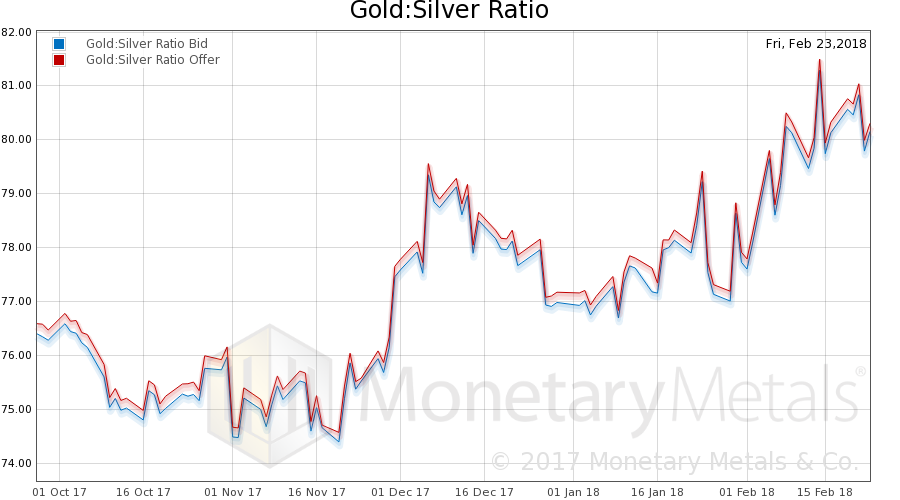
Gold:Silver RatioNext, this is a graph of the gold price measured in silver, otherwise known as the gold to silver ratio (see here for an explanation of bid and offer prices for the ratio). The ratio fell slightly. |
Gold:Silver Ratio(see more posts on gold silver ratio, ) |
Gold Basis and Co-basisHere is the gold graph showing gold basis, co-basis and the price of the dollar in terms of gold price. |
Gold Basis and Co-basis and the Dollar Price(see more posts on dollar price, gold basis, Gold co-basis, ) |
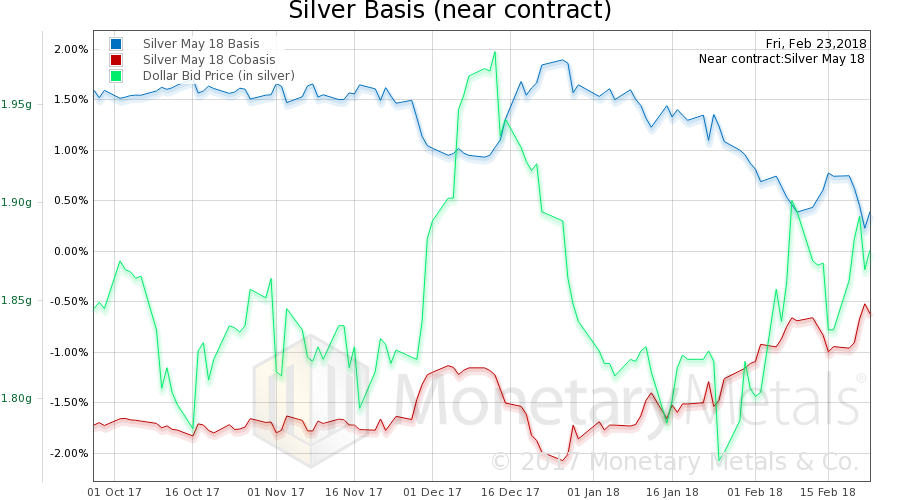
Silver Basis and Co-basisNote that tiny rise in scarcity (i.e., co-basis, the red line) as the price of the dollar rose (inverse of the falling price of gold, in dollar terms). That is the typical pattern. The Monetary Metals Gold Fundamental Price fell this week, to $1,387. Now let’s look at silver. |
Silver Basis and Co-basis and the Dollar Price(see more posts on dollar price, silver basis, Silver co-basis, ) |
The same occurred in silver. The Monetary Metals Silver Fundamental Price fell 7 cents to $17.12.
Interestingly, the Monetary Metals Gold Silver Fundamental Ratio fell in a week when the fundamental prices of both metals fell. It is now at 81.05.
© 2018 Monetary Metals
Full story here Are you the author? Previous post See more for Next postTags: dollar price,gold basis,Gold co-basis,gold price,gold silver ratio,newslettersent,Precious Metals,silver basis,Silver co-basis,silver price


