Major Findings
- The UBS Swiss Real Estate Bubble Index declined in the fourth quarter of 2017, and is currently in the risk zone at 1.32 index points.
- This second fall in succession was driven by the persistently low increase of mortgage volumes. However, this may have been underestimated, as the records of mortgages granted by insurers and pension funds are inadequate.
- The majority of the sub-indicators remained unchanged in the last quarter.
UBS Swiss Real Estate Bubble IndexAt 1.32 points, the UBS Swiss Real Estate Bubble Index was in the risk zone in 4Q 2017. The disparities on the homeowner market declined for the second time in succession. The key factor was the persistently low growth in the mortgage debt of households with the banks, with simultaneously strong income growth in the last quarter. In 4Q, Switzerland recorded its strongest nominal economic growth in almost three years, up 0.6% quarter on quarter. Mortgage debt growth underestimated Household mortgage debt rose by 2.6% last year, considerably below the average for the last 10 years of 3.8%. Even so, the actual volume of outstanding mortgages might have grown more than the data suggest, because insurers and pension funds have started to award more mortgages in recent years. Insurers only hold a market share of around 5%, but the growth rate of their mortgages over the last three years was twice as high as those of the banks. The pension funds’ mortgage books also picked up again significantly from 2016, following several years of declining trends. The UBS Swiss Real Estate Bubble Index could well be slightly underestimating the actual risks at the moment. |
Switzerland UBS Real Estate Bubble Index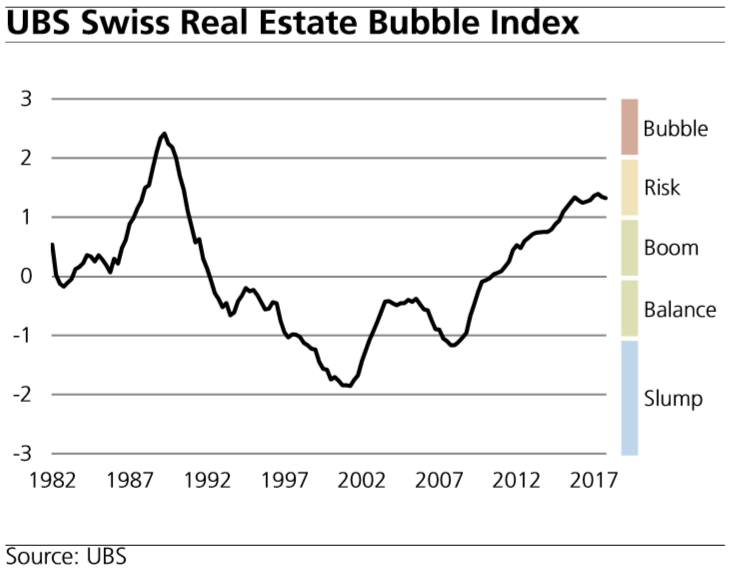 - Click to enlarge |
Increased disparities in the risk regionsHome price inflation was slightly up again in 4Q 2017, compared with the two previous quarters. This stopped a stronger decline in the Real Estate Bubble Index. On the one hand, general inflation persisted at the level of the previous quarter. On the other, asking rents fell by 0.4%. The price-to-rent ratio is thus lurching from one high to the next; it now takes over 30 years’ rent to buy your own home. The highest price-to-rent ratios are to be found in the risk regions of German-speaking Switzerland and the tourist regions, where a home of your own actually costs considerably more than 35 years’ rent. |
Home Price Inflation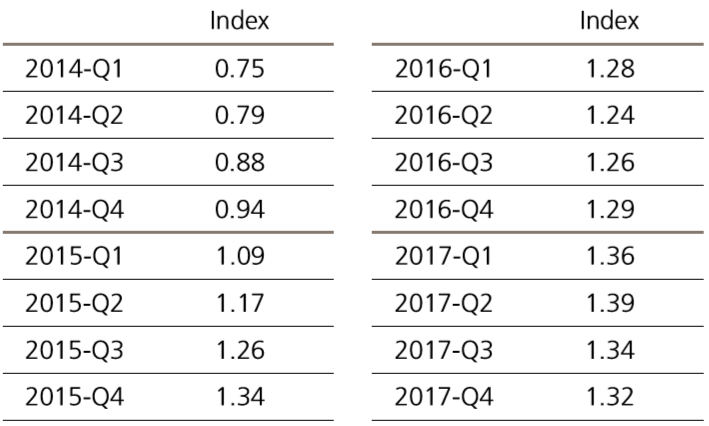 - Click to enlarge |
Sub-indices of the UBS Swiss Real Estate Bubble IndexOwner-occupied home prices relative to annual rent payments
|
Owner-occupied Home Prices Relative to Annual Rent Payments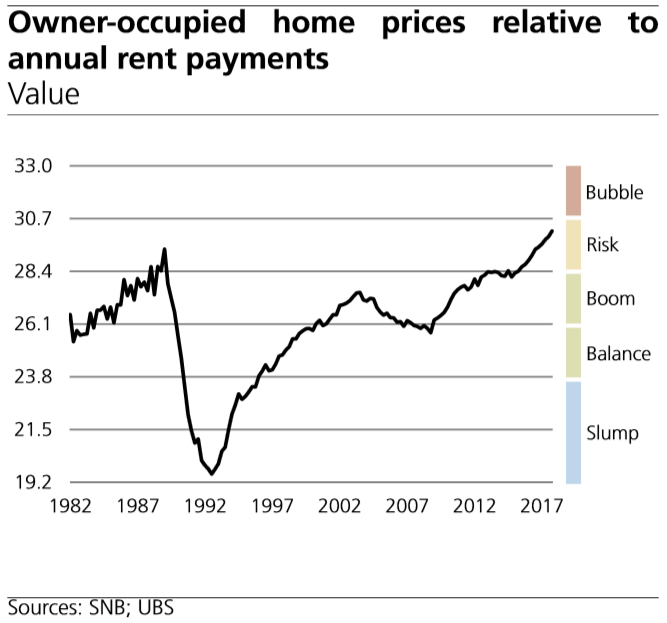 - Click to enlarge |
Owner-occupied housing prices relative to household income
|
Owner-occupied Housing Prices Relative to Household Income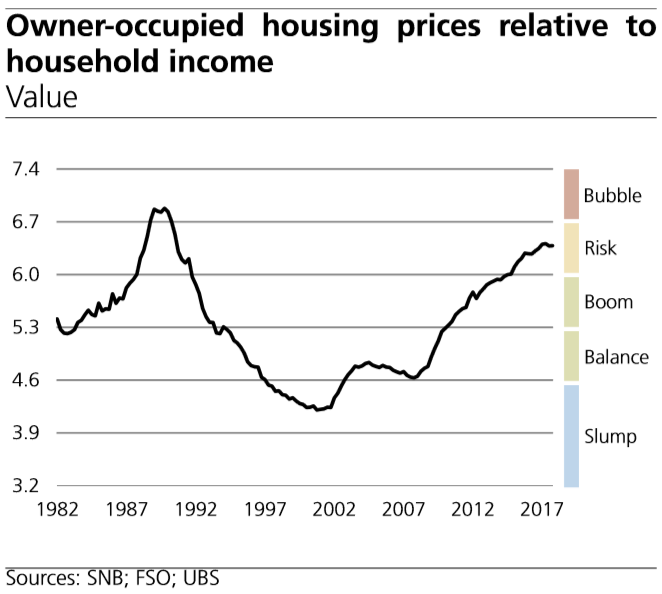 - Click to enlarge |
Construction relative to gross domestic product (GDP)
|
Construction Relative to Gross Domestic Product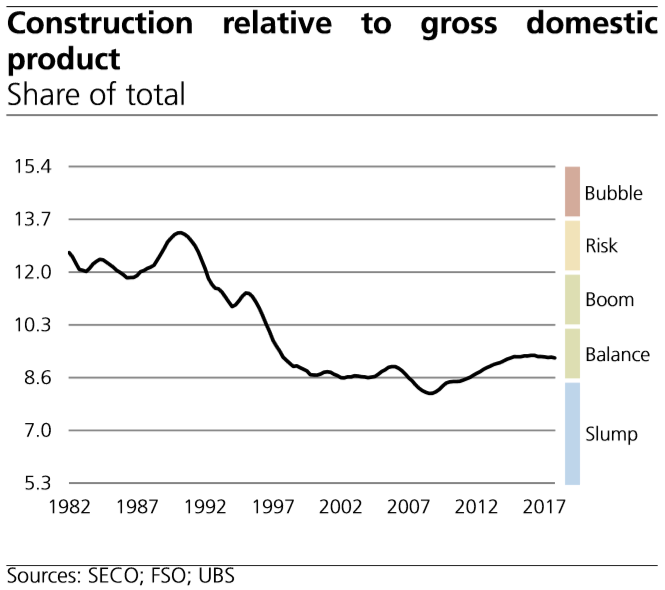 - Click to enlarge |
Owner-occupied home prices relative to consumer prices
|
Owner-occupied Home Prices Relative to Consumer Prices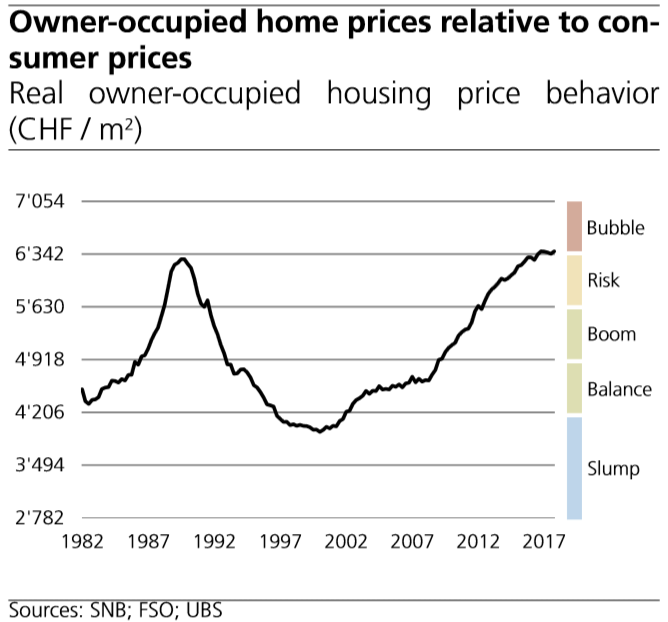 - Click to enlarge |
Mortgage volume relative to disposable household income
|
Mortgage Volume Relative to Income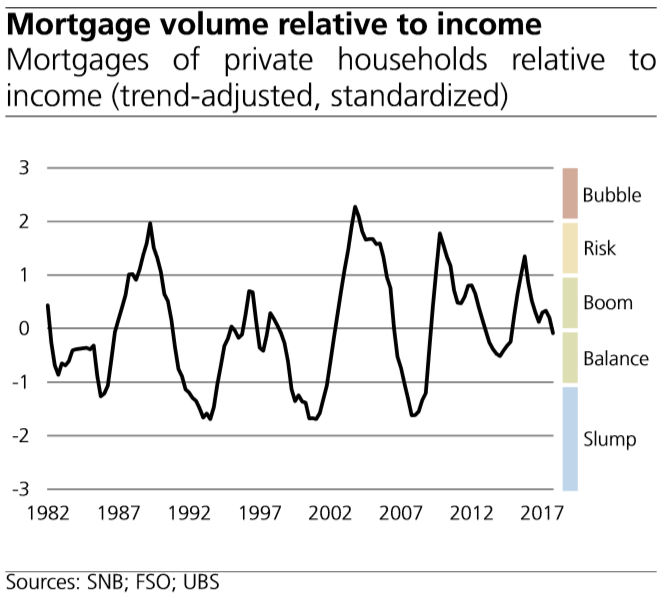 - Click to enlarge |
UBS loan applications for real estate intended for leasing
|
Credit Applications for Residential Property not Intended for Owner Occupancy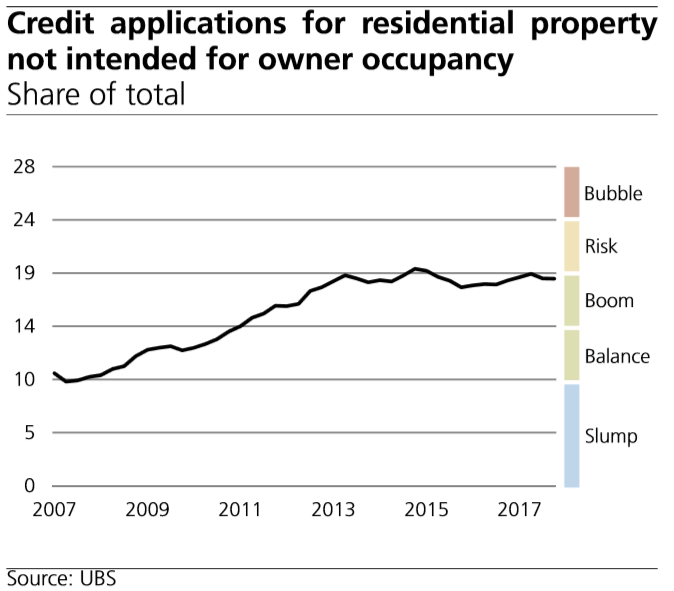 - Click to enlarge |
Regional analysisThe number of risk regions remained unchanged in 4Q 2017. The Geneva and Nyon regions are in a correction phase. Local owneroccupied housing markets have already cooled down in these regions. In the past three years, price corrections in the Valais, the Bernese Oberland and parts of Graubünden have led to no tourist regions being on the risk map anymore. The regional risk focus is gradually shifting from Lake Geneva to the regions of Zurich and Central Switzerland. Methodology The regional risk map shows those regions posing the greatest macroeconomic risks in the event of a Swiss-wide correction. The analysis is based on the population size, the price level and the price behavior for owner-occupied homes. The selection of risk regions is linked to the UBS Swiss Real Estate Bubble Index. Vacancy or liquidity risks are not taken into account. |
Regional Risk Map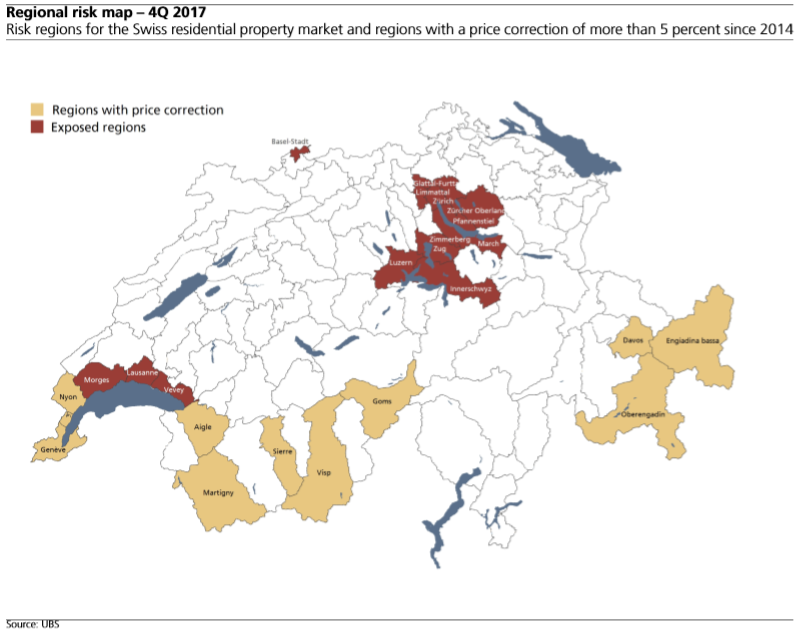 - Click to enlarge |
Tags: newslettersent,Switzerland Real Estate Bubble Index