Summary
Sterling is the second major currency this year after the euro (and its shadow the Danish krone).
The downtrend line from mid-2014 is fraying.
Is this the breakout?
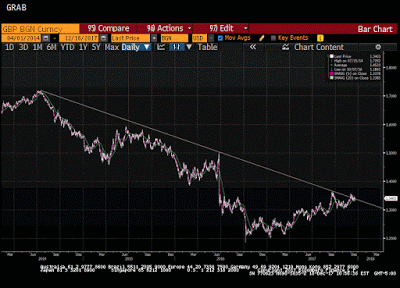
| Sterling has trended higher against the dollar this year, and after the euro (and its Danish shadow), sterling is the strongest of the majors, with an 8.5% gain against the greenback. The gains have brought to to the trend line dawn off the mid-2014 high (a little below $1.72), the referendum high (~$1.50) and September 2017 high (~$1.3660). Depending on precisely how one draws the trend line, it comes in today near $1.3375. This is depicted in the Great Graphic, created on Bloomberg, that is posted here.
We have identified two long-term targets. The first is a little above $1.38, where the 61.8% retracement of the losses from the referendum high is found. The second is $1.3885, which is the 38.2% retracement of the decline since the mid-2014 highs is found. Still, we are not convinced that this is the breakout, and suspect that thin markets are exaggerating the recovery from the poor close last week. Today’s price action remains confined to the pre-weekend range. The US 2-year premium over the UK, unchanged a little below 129 bp is the most in a quarter of a century if not longer. The cross-currency basis swap has recovered somewhat from the pre-weekend spike, but at 65 bp on top of LIBOR, outside of the end of last week, it is the most since the financial crisis. Speculators in the futures market are net long for only the second time since late 2015. The gross long position of 82.6k contracts as of December 12 represents a small pullback from the nearly three-year high seen a week earlier of 89.3k contracts. The gross long speculative position is nearly twice as large as it was a year ago. Initial support is seen near $1.3300. The daily technical indicators are mildly support supportive. Last week’s high near $1.3465 offers nearby resistance. |
GBP BGN Currency |
Tags: #GBP,#USD,Great Graphic,newslettersent


