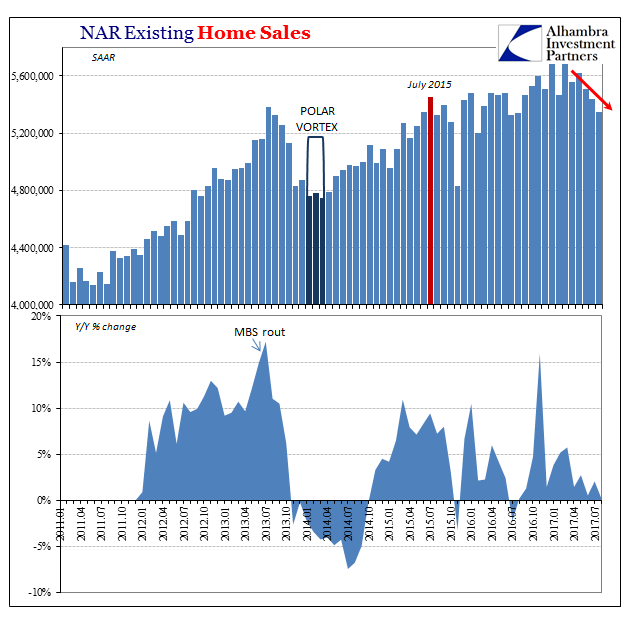
| The National Association of Realtor (NAR) reports today that sales of existing homes in the US were down 1.7% in August 2017 from July. At a seasonally-adjusted annual rate of 5.35 million, that’s the lowest pace for resales since July 2016. It is yet another data point reflecting the almost certain end of “reflation” in the economic sense. |
US Existing Home Sales, Jan 2011 - Jul 2017(see more posts on U.S. Existing Home Sales, ) |
The NAR suggests again this month that the lack of supply available for sale is the primary reason for this softening. I am inclined to agree – up to a point.
|
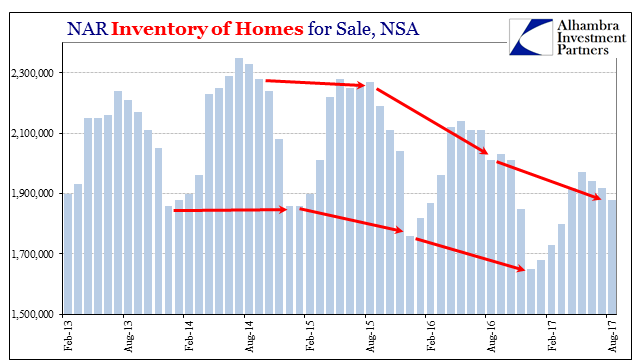
US Inventory of Homes for Sale, Feb 2013 - 2017 |
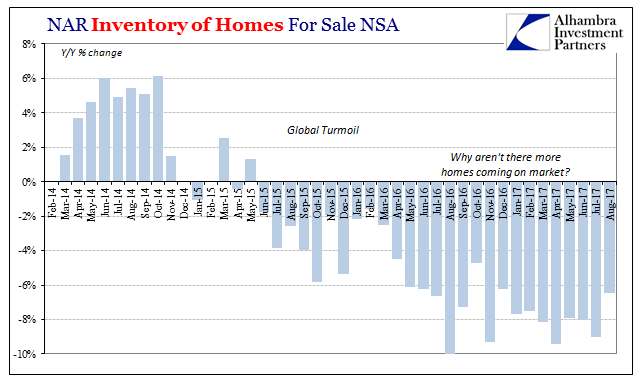
| The flipside to “steady employment gains” and rising incomes, slowly or not, is seller confidence. We cannot ignore the timing of this big and growing shift in this part of the market. According to the NAR’s estimates, housing inventory began to decline in the summer of 2014 coincident to the “rising dollar’s” misunderstood appearance. It accelerated the next summer as the consequences of that monetary event became clear to everyone but economists. It hasn’t been the same since. |
US Inventory of Homes for Sale, Feb 2014 - Aug 2017 |
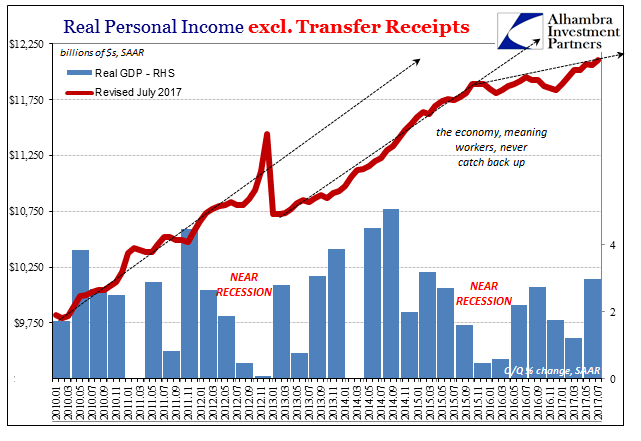
| This durable change for inventory and seller behavior, of course, is quite consistent with the same kind of change in the trajectory of national incomes. Economists can keep calling it “steady employment growth” and it may be in some respects, but it is quite clear in the housing data that from the perspective of American workers the labor market is at best uncertain.
The prospects for current and future employment under such negative terms would easily explain this home seller reluctance. |
US Personal Income, Jan 2010 - Jul 2017(see more posts on U.S. Personal Income, ) |
| If the labor market were actually gaining in steady and predictable fashion, the lack of inventory holding back the housing market, as is claimed, would be spilling over into home construction. In economics (small “e”), demand dictates that somewhere someone will fill the supply. Rising home prices, especially rapidly or robustly, would seem sufficient enticement for builders to build and build some more. |
US Housing Construction, Jan 2009 - 2017 |
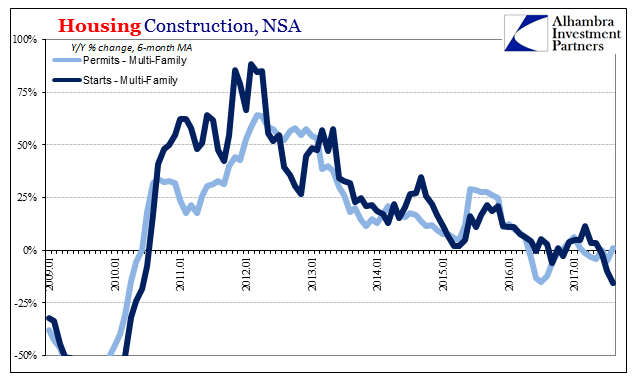
| Yet, they are not. The Census Bureau reported yesterday that home construction remains at best lethargic. There is growth overall in the sector, but it isn’t the kind of growth consistent with the narrative pieced together via the resale conundrum. The primary drag has been in apartment construction, where during this same period in question (dating back to the global turmoil summer of 2015) building in multi-family structures has continued to weaken even throughout the “reflation” found elsewhere. |
US Housing Construction, Jan 2009 - 2017 |
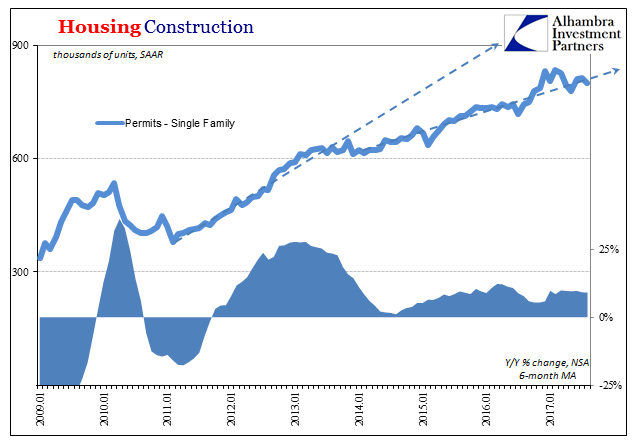
| Even in the single family segment, however, the level of activity and the pace of additional home supply are actually overstated to a significant degree. |
US Housing Construction, Jan 2009 - 2017 |
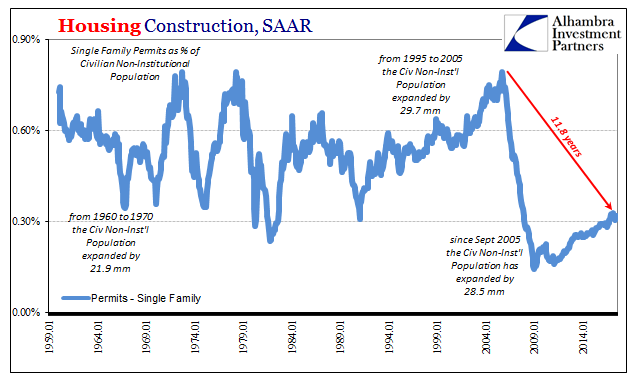
| Builders are adding more homes each year to the nation’s housing stock, but they are doing so at a historically anemic rate (adjusting for population). |
US Housing Construction, Jan 1959 - 2014 |
| It’s been just about 12 years since the housing bubble peaked, enough time for an actual recovery given the almost 30 million new potential workers added to the population in that time. There is on the surface everything going for a true housing boom (as opposed to a bubble). |
Corporate Cash Flow / Monetary Noose, Jan 1985 - 2017, Two Labor Stories, Jan 1985 - 2017, US Retail Sales, Jan 1992 - 2017(see more posts on U.S. Retail Sales, ) |
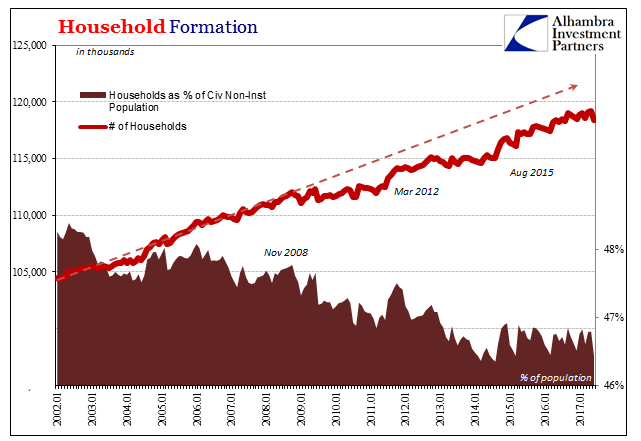
| Instead, the real estate market like the rest of the recovery acts as if there hasn’t been, and is not now, a recovery. The housing market hasn’t grown because the economy hasn’t. It’s a positive corroboration that the Larry Yun’s of the world are ideologically restricted from appreciating and accepting. |
US Household Formation, Jan 2002 - 2017 |
The further significance of housing data in both resales and construction is our contention about the non-cyclical nature of economic changes after 2007 (eurodollar decay). In other words, the housing market as a reflection of the rest of the economy only weakened following the “rising dollar” and the economic downturn resulting from it. Sellers became shy and builders remain reluctant.
The inventory problem isn’t therefore really about inventory at all. Given so much attention paid to this economic sector even directly in the form of QE’s MBS interventions, it’s another discrepancy that adds to the growing evidence for both the failure monetary understanding as well as the more important economic state we are left to deal with even after ten years. As the Japanese have shown, there isn’t any limit to how many decades might be lost.
Tags: Construction,currencies,economy,Federal Reserve/Monetary Policy,Housing,income,Inventory,Labor Market,Markets,newslettersent,Real Estate,resales,U.S. Existing Home Sales,U.S. Personal Income,U.S. Retail Sales


