George Dorgan
My articles My siteAbout meMy videosMy books
Follow on:LinkedINTwitterSeeking Alpha
CFA SocietyEconomicBlogs
We do not like Purchasing Power or Real Effective Exchange Rate (REER) as measurement for currencies. For us, the trade balance decides if a currency is overvalued. Only the trade balance can express productivity gains, while the REER assumes constant productivity in comparison to trade partners.
Who has read Michael Pettis, knows that a rising trade surplus may also be caused by a higher savings rate while the trade partners decided to spend more. This is partially true.
Recently Europeans started to increase their savings rate, while Americans reduced it. This has led to a rising trade and current surplus for the Europeans.
But also to a massive Swiss trade surplus with the United States, that lifted Switzerland on the U.S. currency manipulation watch list.
To control the trade balance against this “savings effect”, economists may look at imports. When imports are rising at the same pace as GDP or consumption, then there is no such “savings effect”.
After the record trade surpluses, the Swiss economy may have turned around: consumption and imports are finally rising more than in 2015 and early 2016. In March the trade surplus got bigger again, still shy of the records in 2016.
Swiss National Bank wants to keep non-profitable sectors alive
Swiss exports are moving more and more toward higher value sectors: away from watches, jewelry and manufacturing towards chemicals and pharmaceuticals. With currency interventions, the SNB is trying to keep sectors alive, that would not survive without interventions.
At the same time, importers keep the currency gains of imported goods and return little to the consumer. This tendency is accentuated by the SNB, that makes the franc weaker.
Texts and Charts from the Swiss customs data release (translated from French).
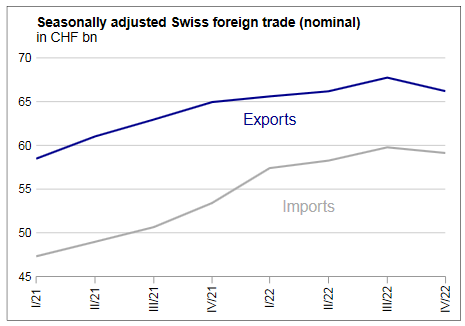
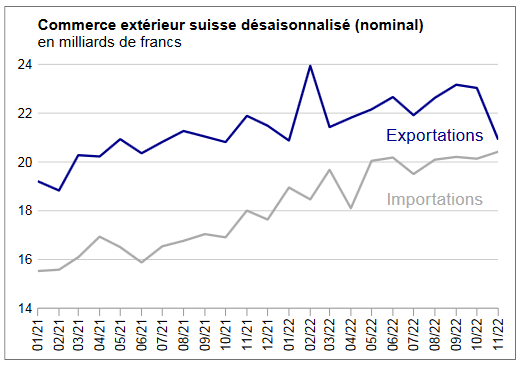
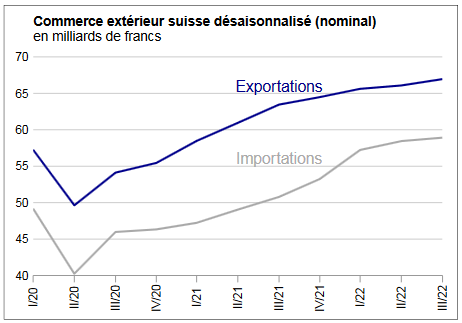
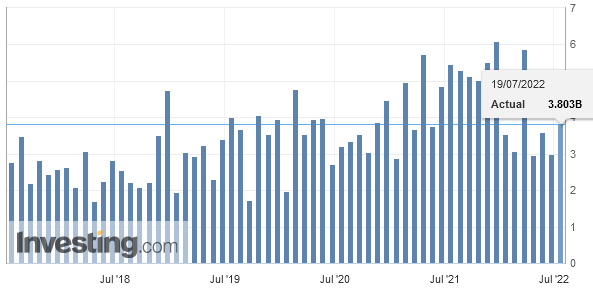
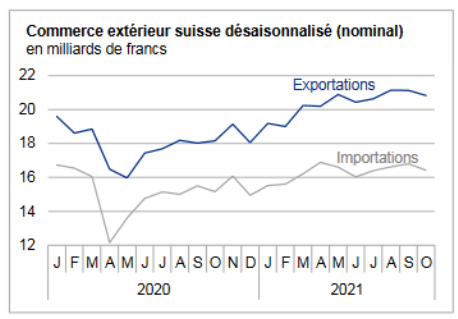
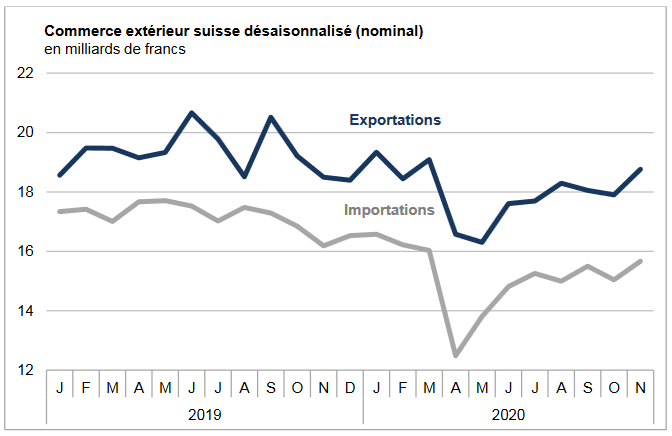
Exports and Imports YoY DevelopmentIn July 2017, after adjusting for working days, exports grew by 4.5%, which were less dynamic than the previous two months. Imports rose red (-0.5%). The trade balance loops with a surplus of 3.6 billion francs. ▲ Exports of chemistry – pharma continued to surf the wave of success |
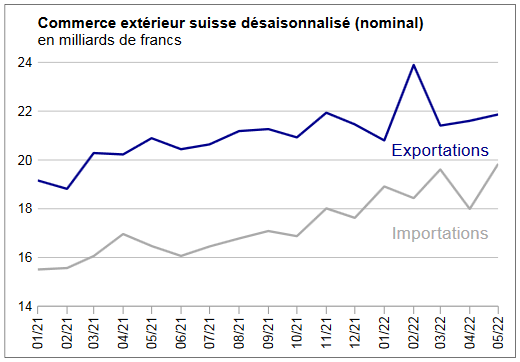
Swiss exports and imports, seasonally adjusted (in bn CHF), July 2017(see more posts on Switzerland Exports, Switzerland Imports, )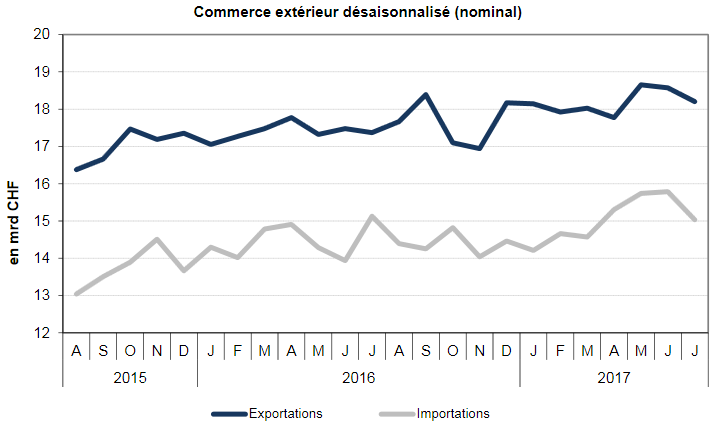 Source: Swiss Customs - Click to enlarge |
Overall EvolutionIn July 2017, exports adjusted for working days increased by 4.5% over one year (actual: + 0.6%). After two months at a high level, seasonally adjusted exports fell 2.0% on a month (real: -1.7%). Adjusted imports declined slightly in one year (-0.5%, real: -0.9%). After seasonal adjustment (comparison with the previous month), they even fell by 4.8% (real: -1.0%). The upward trend since the beginning of the year has suffered a halt.
|
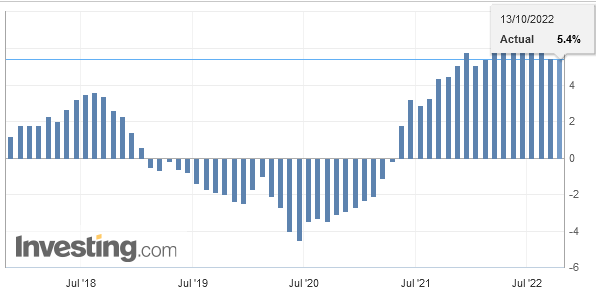
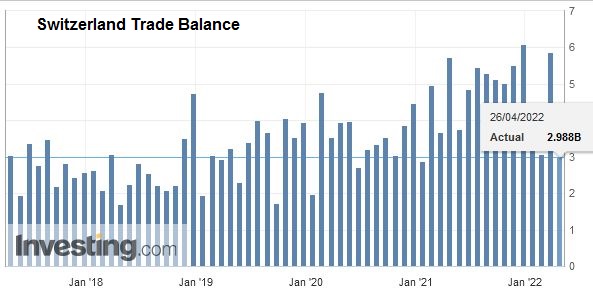
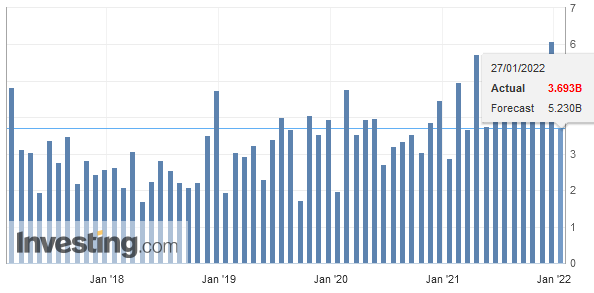
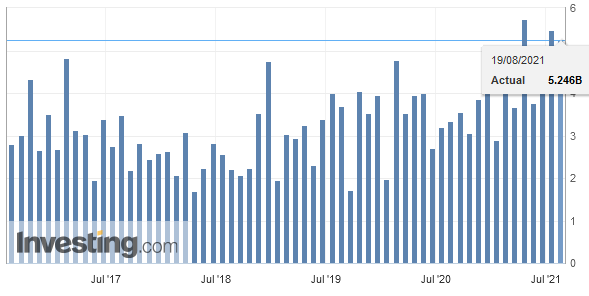
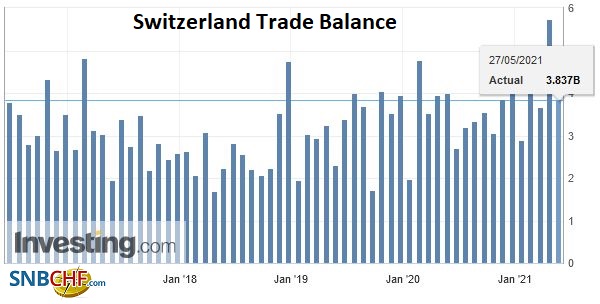
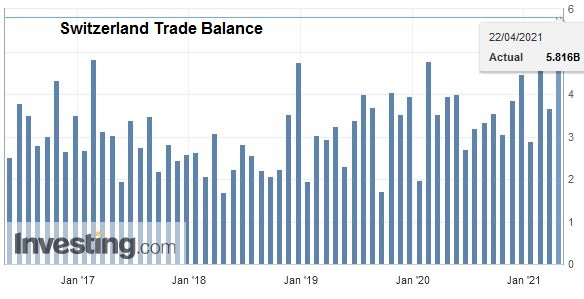
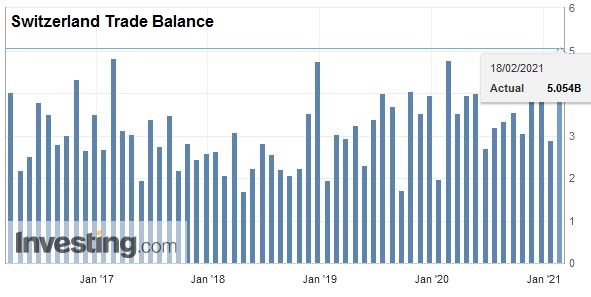
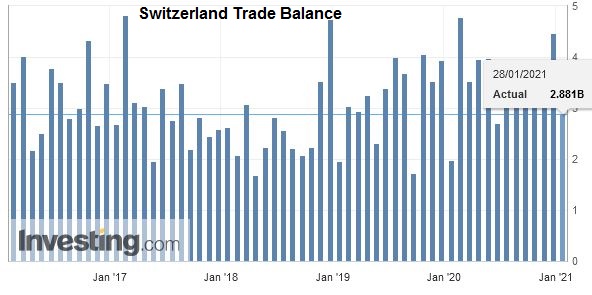
Switzerland Trade Balance, July 2017(see more posts on Switzerland Trade Balance, )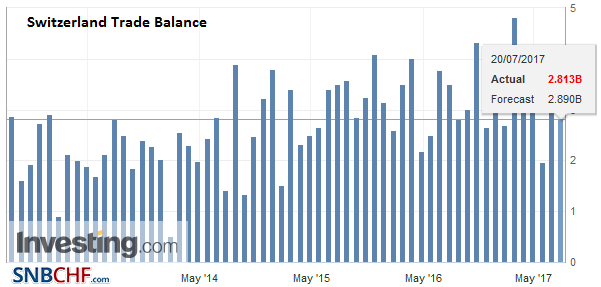 Source: Investing.com - Click to enlarge |
ExportsBond of 837 million francs of exports to the USA In July 2017, commodity groups evolved in a wide range: exports of textiles, clothing and footwear (merchandise returns) were up by 27%, while jewellery and jewellery exports were the most dynamic. Dropped a fifth, pointing all the way down the ladder. Vehicle sales accelerated by 16% (railway and aeronautical vehicles). The flagship sector, chemicals and pharmaceuticals, rose by 10% or 819 million francs. Immunological products increased by a third (+646 million rancs). Metals grew by 9% as against 4% for watchmaking. While precision instruments grew by 1%, the machinery and electronics sector grew shrinking. With the exception of Europe (-4%), Swiss exports have gained ground in all markets. Demand in North America and Asies was up three tenths (US: +837 million francs) and 9%, respectively. As for Asia, Singapore (+213 million; pharma) and Hong Kong (+89 million) in particular shone. On the Old Continent, France (-375 million) and Germany (-122 million) pulled the result down. The French partner has suffered above all from the reverse of jewelry and jewelry. Conversely, shipments to Italy had the wind in their sails (+99 million). |
Swiss Exports per Sector July 2017 vs. 2016(see more posts on Switzerland Exports, Switzerland Exports by Sector, )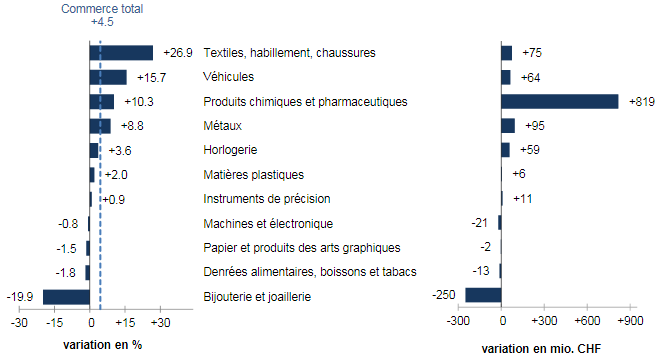 Exports by commodity group: Nominal changes adjusted for working days compared with July 2016 Source: Swiss Customs - Click to enlarge |
Imports7 sectors out of 12 despite rising The slight drop in entry came from the contraction of vehicles (-320 million francs, airliners) as well as jewelery (-186 million). Energy products also fell (-4%, real: -9%). On the right side of the bar are the flagship sector, chemicals and pharmaceuticals (+ 8%, +305 million). Imports fell by one tenth, followed by textiles, clothing and footwear (+ 9%; -0%). In chemicals and pharmaceuticals, raw materials and basic chemicals rose by 298 million francs as against 210 million francs for immunological products. The active ingredients, on the other hand, beat the wing. Within the machinery and electronics sector (+ 6%), motor vehicles were up (+ 56%, +61 million francs). A 6% increase also characterized plastics. In terms of geography, imports fell in North America and the United States (-372 million francs, respectively). Conversely, the two other main suppliers, Asia (+ 2%) and Europe (+ 4%), showed an increase. For the first, the rise of China contrasted with the plunge of Viet Nam. On the European side, imports from the United Kingdom (+197 million, pharma) and Italy (+153 million) were booming while those from France were weakening. |
Swiss Imports per Sector July 2017 vs. 2016(see more posts on Switzerland Imports, Switzerland Imports by Sector, )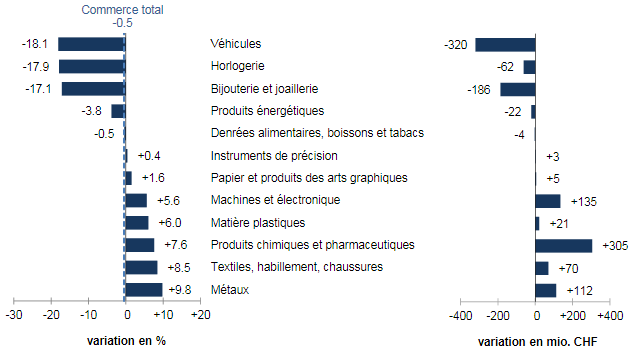 Imports by commodity group: Nominal changes adjusted for working days compared with July 2016 Source: Swiss Customs - Click to enlarge |
Full story here Are you the author?
Tags: newslettersent,Switzerland Exports,Switzerland Exports by Sector,Switzerland Imports,Switzerland Imports by Sector,Switzerland Trade Balance