Keith Weiner
My articles My offerMy siteAbout meMy videosMy books
Follow on:LinkedINTwitterSeeking AlphaFacebookAmazonGoogle +
See the introduction and the video for the terms gold basis, co-basis, backwardation and contango.
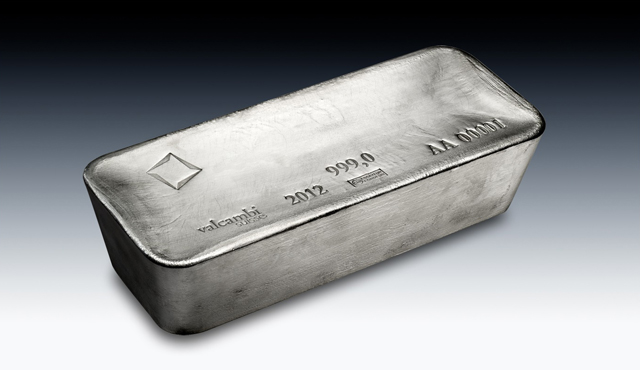
Last Week in Precious Metals: Peak Hype, Stocks vs. Flows and CapitulationThe big news this week was the flash crash in silver late on 6 July. We will shortly publish a separate forensic analysis of this, as there is a lot to see and say. Silver – 1,000 troy ounce good delivery bars, approved by the COMEX. Whatever you do, do not let one of these things land your feet. For readers used to the metric system: these bars weigh approximately between 28 to 33 kilograms (their weight is allowed to fluctuate in a reasonable range around 1,000 troy ounces; good delivery bars are inter alia stamped with their precise weight). They make for excellent door stops, but are at the same time potentially painful toe-stubbing obstacles. |
 - Click to enlarge |
| It’s hard to tell — we don’t have the tools to measure such a thing — but it seems like the hype and aggression from the gold bugs and conspiracy theorists is reaching a fever pitch.
For example, one high-profile commentator, whose reputation goes way beyond the world of gold, claimed that 1.8 million ounces of gold were sold in a few seconds on June 26. A contract is 100oz, so that means 18,000 contracts. Surprisingly (so often these guys are off by orders of magnitude), this is in line with the data in our own analysis. On a typical day, it is common for 250,000 (active month) contracts to change hands. This is about 777 tons. That conspiracy theorist compares this quantity to the amount produced by the miners. He does not acknowledge that virtually all of the gold ever mined in human history is still in human hands, and all of that metal is potential supply, at the right price and under the right conditions. And there is another point. Of course, in a free market there would be no futures market in gold or silver. A futures market is for goods that are produced seasonally, but consumed throughout the year. It is a market for warehousing. There would be an interest-rate market for gold, i.e. a bond market. A gold futures market is a bizarre creature, a Frankenstein created by the artificial environment of irredeemable currencies and laws that force everyone to use them. A “flash crash” on large volume during times when trading volume is normally subdued is unusual (as the chart shows, prices recovered very quickly – these are hourly candles), but it still doesn’t make any sense to compare these trading volumes to annual mine production. Both gold and silver have enormous stock-to-flow ratios, which are a function of their role as monetary assets. Around 600 tons of gold trade in the London market alone every day. We would guesstimate that globally, an amount equal to annual mine production changes hands every 1.5 to 2 working days. |
 - Click to enlarge |
A futures market for gold is a mechanism to turn gold into a chip in the casino, just another way for speculators to bet on the price action, to generate profits in dollars. Like all other derivatives markets, the gold futures market offers leverage, so that traders can maximize profits even when price moves are small.
Of course, big leveraged positions mean big risk. That is why traders must set tight stop-loss orders, creating opportunities for other speculators to hunt for stops, adding even more risk to the casino. And it is also the basis (no pun intended) of our basis analysis.
We like to see how much these leveraged bettors are moving the price.
Anyway, back to the idea of peak hype. We think – but again it is hard to tell – that this corresponds to peak desperation from those who sell gold for a living.
Profits per ounce are down, and so are ounces sold. The reality is that it’s a moribund market out there these days. If you have a frank and sober discussion with your local precious metals dealer — it may help to do this over a beer or two — you will get the same answer. There’s little buying action at the retail level.
Peak hype, peak desperation, all selling in the streets with little buying… we are not technicians and do not focus on sentiment, but this description certainly sounds like the very definition of capitulation.
We would think that the hypsters have about exhausted their credibility by now, after having predicted 100 of the past zero moonshots since 2011. Of course, even if the price is now making a low, these stopped clocks cannot be called correct for making a bullish prediction. Their writing is not really a forecast, but a sales pitch, perennially bullish.
Also, we would add something important. Even if this is a capitulation low, that does not necessarily a mean that a moonshot to $5,000 or even $2,000 is imminent.
We don’t expect that, and won’t expect it without evidence of a much more serious shift in the fundamentals. We would expect a normal trading bounce within the recent range, perhaps to a few bucks over $1,300.
Fundamental Developments – The Gap Between Fundamental and Market Prices Widens FurtherThe prices of the metals fell $29 and $1.02 last week. As always, we are interested in the fundamentals. Did the market change in a sustainable way? Are gold and silver being devalued? Is it time to capitulate and avoid the rush? Monetary Metals publishes the only true measure of the fundamentals. But first the charts of their prices and the gold-silver ratio. |
Gold and Silver Prices, February 2017 - July 2017(see more posts on Gold and silver prices, )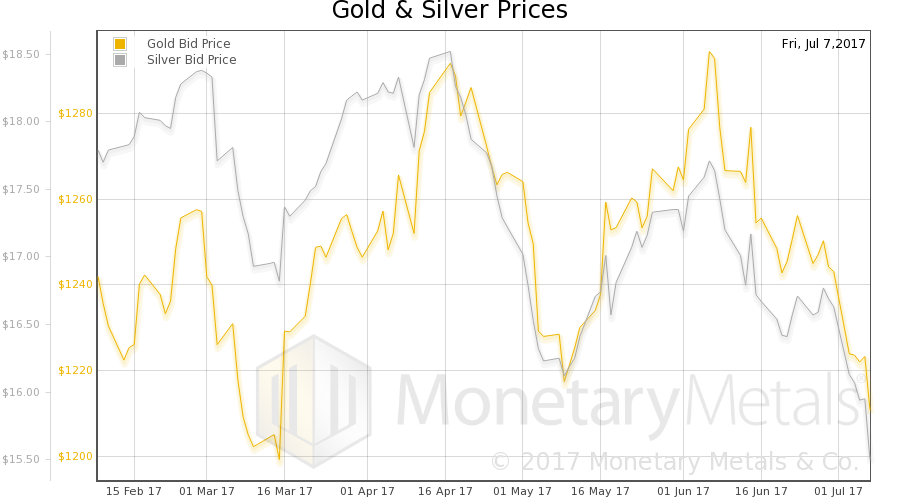 - Click to enlarge |
| Next, this is a graph of the gold price measured in silver, otherwise known as the gold to silver ratio. The ratio moved up sharply this week, to a new high for the move, over 78.
Gold-silver ratio (bid and offer) – a side note: we haven’t really mentioned the gold-silver ratio lately in our updates of macroeconomic price drivers and indicators lately, but the way to look at it is that it is akin to credit spreads, an indicator of general economic confidence. The reason is that silver has a comparatively large industrial demand component, hence it will tend to strengthen relative to gold when industrial demand for commodities is perceived to be strengthening and vice versa. A strongly rising gold-silver ratio (gold becomes more dear relative to silver) indicates that economic confidence is waning. It is interesting to note that central banks are suddenly sounding hawkish just as this is happening. A case of bad timing, presumably. |
Gold: Silver Ratio, February 2017 - July 2017(see more posts on gold silver ratio, )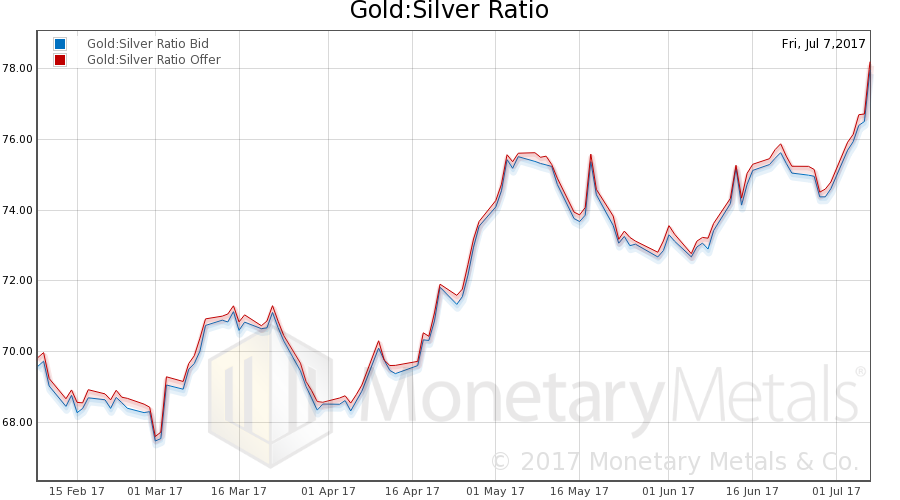 - Click to enlarge |
Here is the gold graph. August gold basis (blue) and co-basis (red) and the US dollar priced in milligrams of gold (green). By now gold is in mild backwardation, which is quite rare and generally considered bullish. Since the global inventory of gold adds up to more than 70 years of fabrication and industrial demand, this market should never be in backwardation, simply because “supply shortages” are not supposed to happen (except perhaps temporary shortages in certain forms of gold, such as coins or certain bar sizes – that happened e.g. during the euro area debt crisis in 2011). The biggest physical demand component is reservation demand, the bulk of which consists of investment or monetary demand. Backwardation indicates that speculators are underestimating the current state of this demand component.
|
Gold Basis and Co-Basis, February 2017 - July 2017(see more posts on gold basis, Gold co-basis, )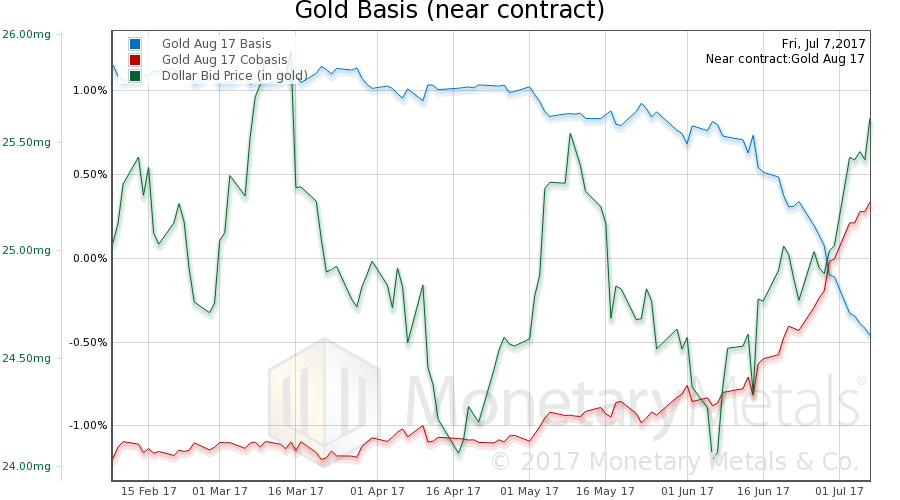 - Click to enlarge |
| We had a rising price of the dollar (the mirror image of the falling price of gold). Look at it rise. Those who are all-in on the dollar (which is most people) must be feeling pretty smug right now, unless they measure their dollar against its derivatives such as euro, pound, etc. This is a similar mistake as measuring gold in dollars.
In any case, note the rising backwardation in August gold. Now well over +0.3%. For the October and December contracts, the co-basis is -0.2% and -1%. So it’s still a temporary backwardation, though October is a ways into the future and -0.2% is high. Our calculated gold fundamental price actually rose about $11 (chart here), to $1345. Now let’s look at silver. Last week, the September silver co-basis hit 0, the same as gold. This week it is over +0.9%. The December co-basis is 0. That is interesting. Zero is an interesting number for the co-basis, because it is the margin where decarrying becomes profitable. Decarrying is when you sell metal and buy a futures contract to recover the position. This trade does not require credit, only the metal. Last week we said:
And how! Of course, this was with the dollar rising very sharply in silver terms, from 1.85 grams of silver to 2 grams. Our calculated silver fundamental price did correct a bit, by 26 cents to $17.59 – the discount of the market price is even greater now than it was a week earlier. |
Silver Basis and Co-Basis, February 2017 - July 2017(see more posts on silver basis, Silver co-basis, )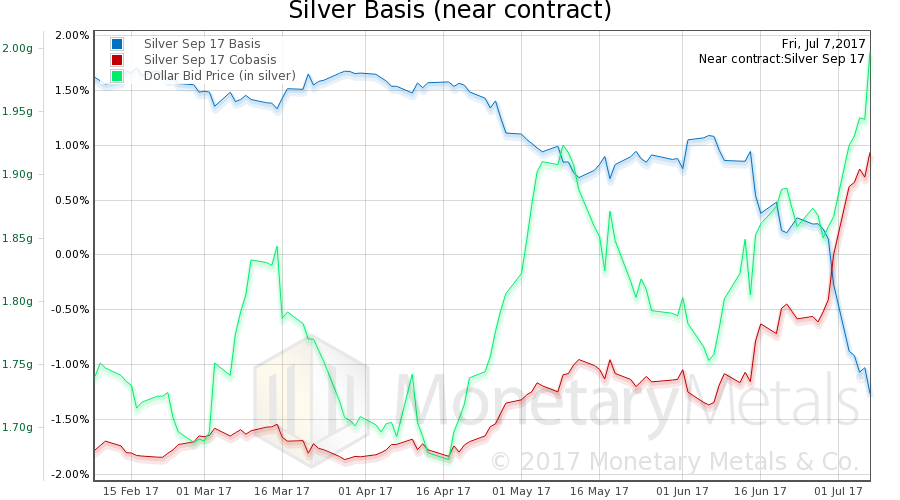 - Click to enlarge |
Tags: Gold and silver prices,gold basis,Gold co-basis,gold silver ratio,newslettersent,Precious Metals,silver basis,Silver co-basis