


Marc Chandler
My articles My offerMy siteAbout meMy videosMy books
Follow on:LinkedINTwitterSeeking AlphaAmazon
George Dorgan
My articles My siteAbout meMy videosMy books
Follow on:LinkedINTwitterSeeking Alpha
CFA SocietyEconomicBlogs
Summary
- Downside momentum is fading and technicals are showing a bullish divergence.
- The Dollar Index has not met the minimum corrective retracement target, meaning that it is premature to talk about bear market.
- We identify two pre-conditions to enter trade.
| The Dollar Index set the year’s high on January 3 a little above 103.20. Today it made a marginal new lows for the year at 95.464. The previous low, set at the end of last month was 95.47.
As this Great Graphic from Bloomberg illustrates the down trend is very much intact (white line) and has accelerated since the the last three months (steeper red line). The 2016 low was set in early May a little below 92.00. The Dollar Index took a little more than six months to unwind the gains it scored between the US election last November and January 3. There have been several points along the way that looked like a possible turning point. Another such window appears to be opening soon. Here is why: The marginal new lows were not confirmed by technical indicators. In the chart above, we added the MACDs. It made its lows near the middle of May. This is what technicians call a bullish divergence, and it is found with other technical indicators as well. In addition to the technical consideration, the two-year differential bottomed in late June a little above the April and May lows near 1.92%. It is now near 1.97% . A key level on the upside is 2.02%. On the other hand, the 10-year interest rate differential recorded new lows for the year yesterday near 1.72%. It finished last month a dozen basis points higher. The low from last November was near 1.65%. The low from last year was nearer 1.48%. In 2013 and 2014, the Dollar Index carved out a low a little below 79.00. The first leg up was from mid-2015 through early 2015, peaking near 100.00. It made a new high in late 2015, around the time of the Fed’s first hike but stalled near 100.50. The second leg up began in May 2016 form a little below 92.00 and peaked at the end of 2016 and early 2017 near 103.80. The Dollar Index has not met the minimum retracement objective (38.2%) of the rally since 2014. That level seen close to 94.30. Although there are some claims out there that the dollar is in a bear market, discipline would seem to require meeting retracement levels that are seen as a correction rather than a trend reversal. Discipline also requires a strategy to recognize if the Dollar Index has bottomed. We suggest two conditions ought to be met. First, that the Dollar Index trades above 96.20, and second that interest rate differentials begin trending back in the US favor. This applies to the 10-year premium as well as the 2-year. |
US Dollar Index, October 2016 - July 2017(see more posts on US Dollar Index, )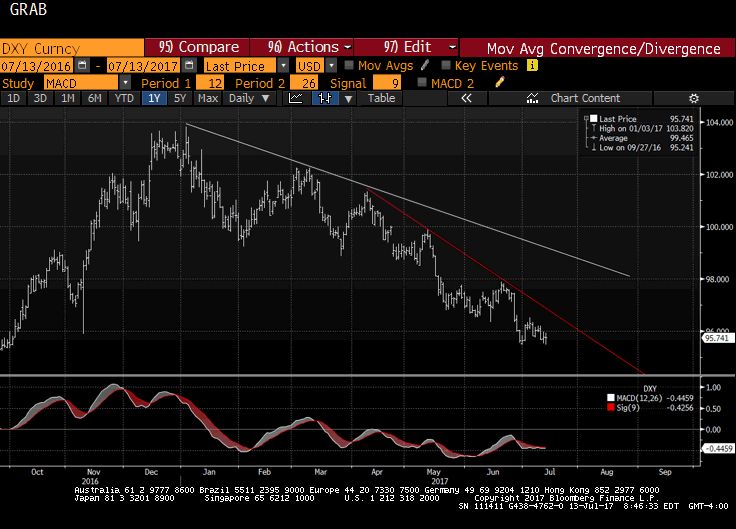 - Click to enlarge |
Full story here Are you the author?
Tags: #USD,Great Graphic,Interest rates,newslettersent,US Dollar Index


