Jeffrey P. Snider
My articles My offerMy siteAbout meMy videosMy books
Follow on:LinkedINTwitterSeeking Alpha
| Earlier this month, the BEA estimated that Disposable Personal Income in the US was $14.4 trillion (SAAR) for April 2017. If the unemployment rate were truly 4.3% as the BLS says, there is no way DPI would be anywhere near to that low level. It would instead total closer to the pre-crisis baseline which in April would have been $19.0 trillion. Even if we factor retiring Baby Boomers in a realistic manner, say $18 trillion instead, what does the world look like with that additional $3.6 trillion of American income? |
U.S. Disposable Personal Income, January 1885 - June 2017(see more posts on disposable personal income, )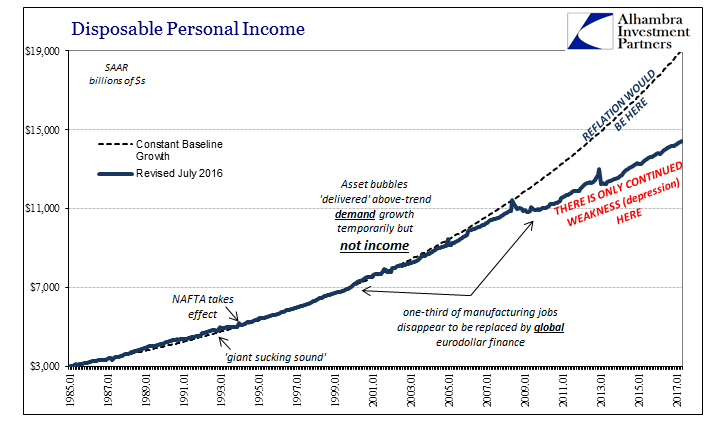 - Click to enlarge |
| It is the one that is currently being described, that which earlier this year was supposed to set up the bond market for a 1994-style “massacre.” Reflation was not just some nebulous idea, though it arose out of nothing but faith, rather it was the belief in a realistic trajectory back to $19 or even $18 trillion in income (maybe $17 trillion). At that level of future income, a lot of deficiency about the current economy would quickly vanish. |
US Retail Sales Stagnation, January 2007 - June 2017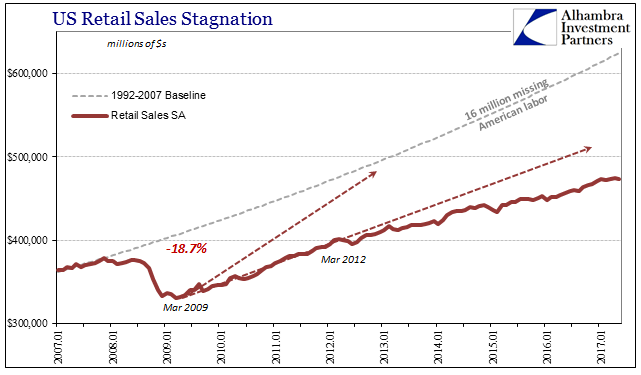 - Click to enlarge |
|
That would apply, of course, to far more than domestic circumstances. The rest of the world would be awash in US demand in terms of actual spending (the strong consumer in fact rather than just constant description). The feedback and spillover effects would restart what are now painfully broken foreign economies (not just in Brazil). It would mean robust wage growth and therefore inflation, but long before those were picked up in contemporary statistics there would be actual demand for people and goods to be moved about. That would mean oil. The inventory of the stuff would dwindle in rapid fashion, taking with it upward the various global benchmark prices including WTI. Inflation expectations would be bolstered, and then actual inflation indices full of those favorable (from the perspective of global policy) price comparisons. |
Oil Prices, May 2016 - June 2017(see more posts on oil prices, )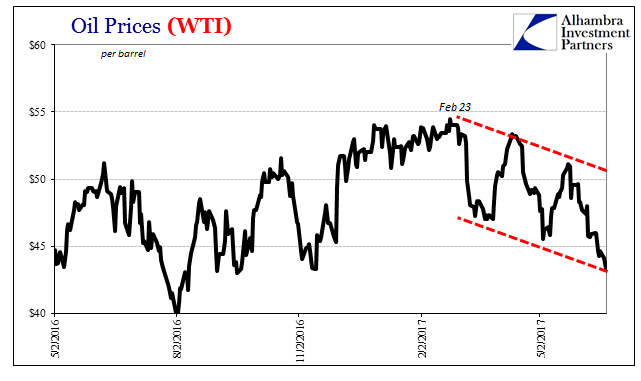 - Click to enlarge |
| The breakdown of oil prices this week has been punishing for all the disappointing reasons of what is increasingly likely never to happen (at least so long as nothing is meaningfully changed). It is a market check of assumptions, the main assumptions. They have of late all failed. |
Oil WTI Futures, December 2016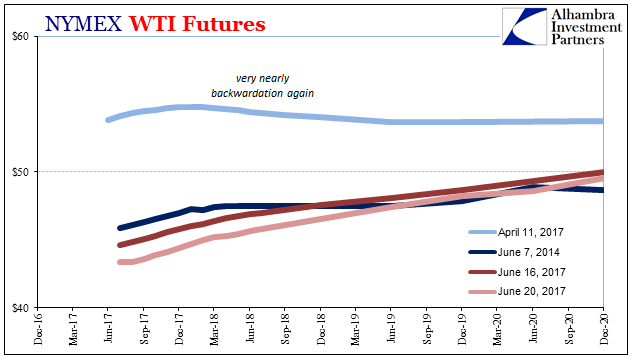 - Click to enlarge |
| This shouldn’t have been a surprise, because in reality there wasn’t ever a realistic path to $16 trillion let alone any better income level closer to normal. That distinctly low probability was contained in the oil price itself. Though WTI rose precipitously from the bottom in February 2016, it wasn’t ever “up.”
|
Oil Prices , January 2011 - June 2017(see more posts on oil prices, )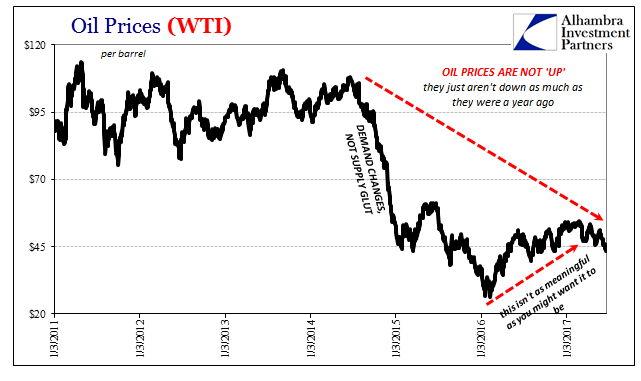 - Click to enlarge |
| WTI is putting in lower highs and now again lower lows. With them departs what was left of faith in that upward path to global redemption. |
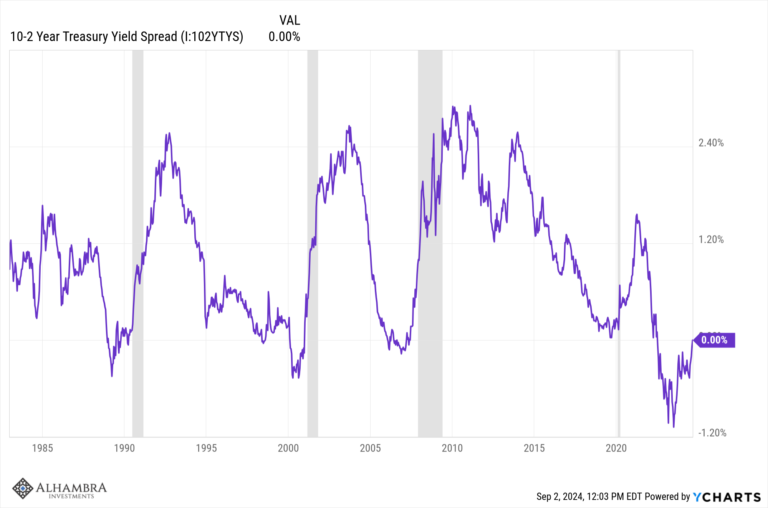
Central Curve 2s10s, April 2008 - June 2017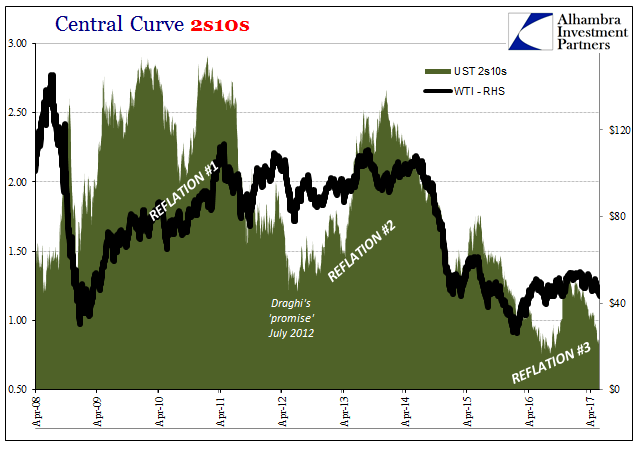 - Click to enlarge |
| The UST yield curve flattens out again in some places worse than last summer at what may have seemed the lowest or most pessimistic point of the whole past decade. |
Inflation Expectations, January 2003 - June 2017(see more posts on inflation expectations, )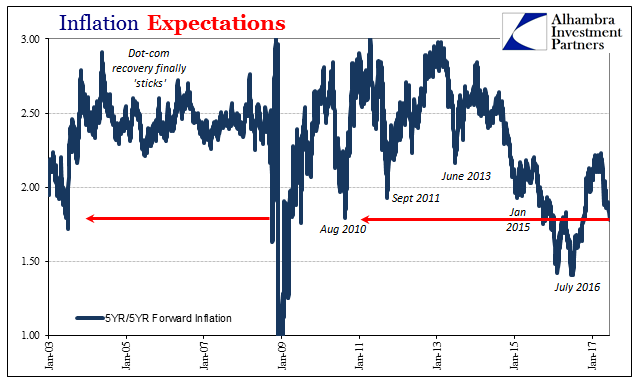 - Click to enlarge |
| Though economists have so much trouble with bonds and curves, it really is just that simple. |
Inflation Expectations, July 2016 - June 2017(see more posts on inflation expectations, )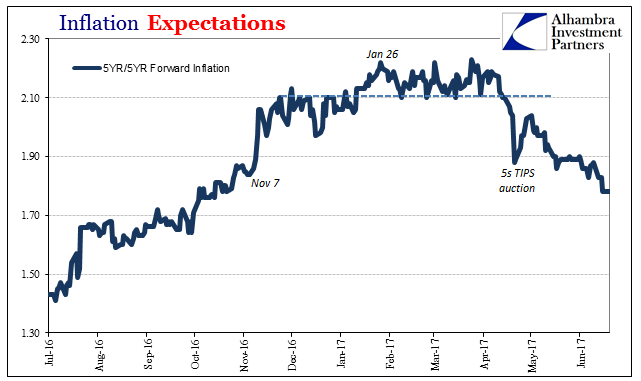 - Click to enlarge |
| If nominal rates were truly rising, and the curve still flattening, that would be in concert with oil moving back to $100 or more and a realistic shot at reaching $18 trillion or better. |
Belly of the Curve 5s10s, July 2016 - June 2017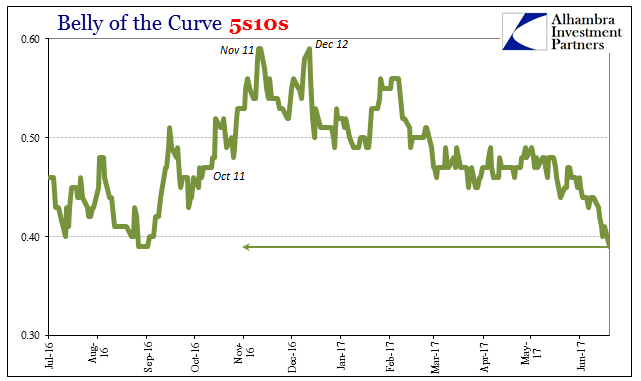 - Click to enlarge |
| The world economy shifts to a far better look long before ever reaching that point. |
Belly of the Curve 5s10s, March 2009 - June 2017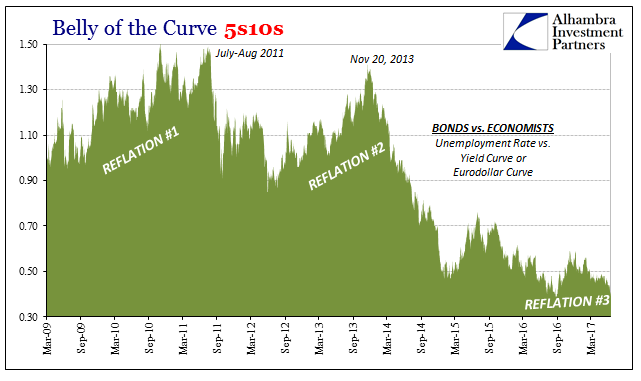 - Click to enlarge |
| Low and flat curves, however, are suggesting the high probability of $14 trillion remaining the baseline trajectory reflecting a global system that can’t ever get out of its own way. |
Central Curve 2s10s, February 2016 - June 2017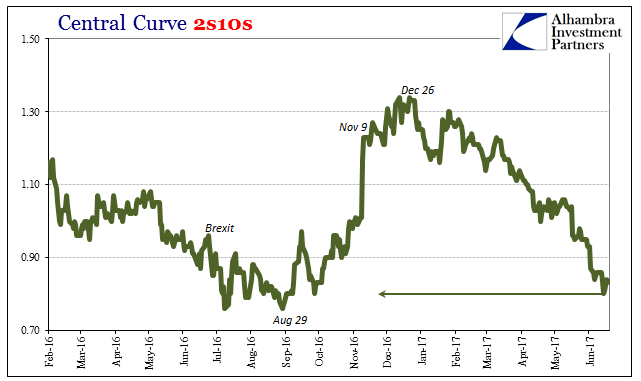 - Click to enlarge |
| If the performance after three years of “transitory” factors is still more than half down, then economic considerations are much worse than “reflation” or even cyclical considerations (downturn/upturn). |
Central Curve 2s10s, April 2008 - June 2017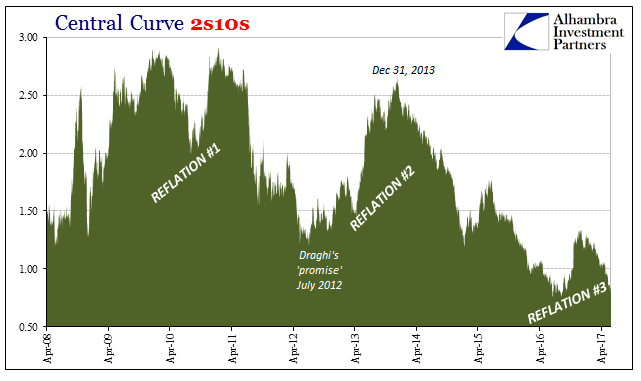 - Click to enlarge |
| There is only trouble at $14 trillion (there’s probably a fair amount of trouble still at $17 trillion). |
Broad Curve 5s30s, July 2016 - June 2017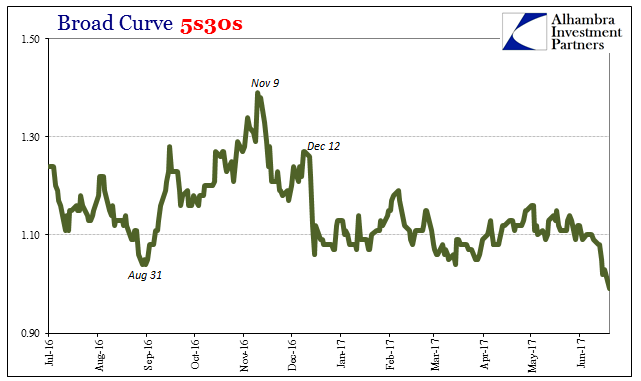 - Click to enlarge |
| It’s not renewed recession risk that is on the minds of bond investors (liquidity preferences), it is the further acceptance of the implications of being unable to move past the last one still after so much time. |
Broad Curve 5s30s, April 2008 - June 2017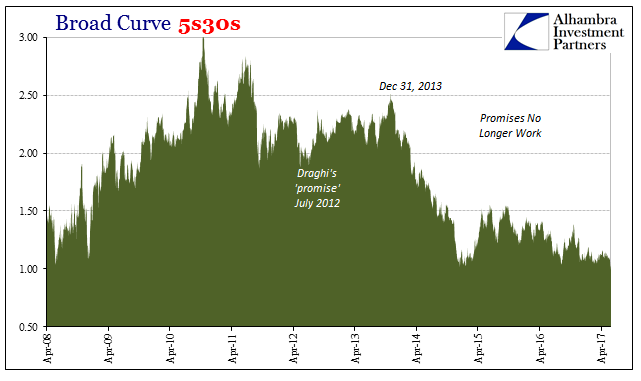 - Click to enlarge |
Full story here Are you the author?
Tags: bond market,Bonds,commodities,currencies,disposable personal income,dollar,economy,EuroDollar,Federal Reserve/Monetary Policy,inflation expectations,Markets,newslettersent,oil prices,U.S. Treasuries,unemployment rate,WTI,Yield Curve