


Jeffrey P. Snider
My articles My offerMy siteAbout meMy videosMy books
Follow on:LinkedINTwitterSeeking Alpha
| JOLTS figures for the month of April 2017, released today, highlight what is in the end likely to be a more positive outcome for them. It has very little to do with the economy itself, as what we are witnessing is the culmination of extreme positions that have been made and estimated going all the way back to 2014. At that time, the BLS in its various data series suggested an almost perfect labor market acceleration that simply wasn’t matched by anything else. At best, GDP accelerated but only for two quarters in the middle of that year.
At the time, however, these labor markets estimates were not so much outlandish as uncorroborated. They still resided well within the bounds of plausibility, isolated though clearly not ridiculous. In early 2017, however, they have leapt far beyond that boundary, and therefore are demonstrating conclusively that the trouble resides in the statistics as well as the economy. |
U.S. Job Openings, December 2000 - June 2017 - Click to enlarge |
| The Establishment Survey was once part of this select group, though having slowed so much since 2015 it is now clear on the other side of the ledger standing against it. That has left the unemployment rate to still practice its precipitous drop to lows that just don’t fit reasonable interpretations. With it has been Job Openings, the portion of the JOLTS data that most represents exclusively labor demand. |
U.S. Hires, December 2000 - June 2017 - Click to enlarge |
| The BLS estimates that Job Opening surged in April 2017. Reaching above 6 million for the first time in its history, the increase was more than a quarter of a million in this latest month alone. It would seem in keeping with at least the narrative of an improving economy, as the trend this one account has been nearly straight up for all of this year. |
U.S. Hires, January 2009 - June 2017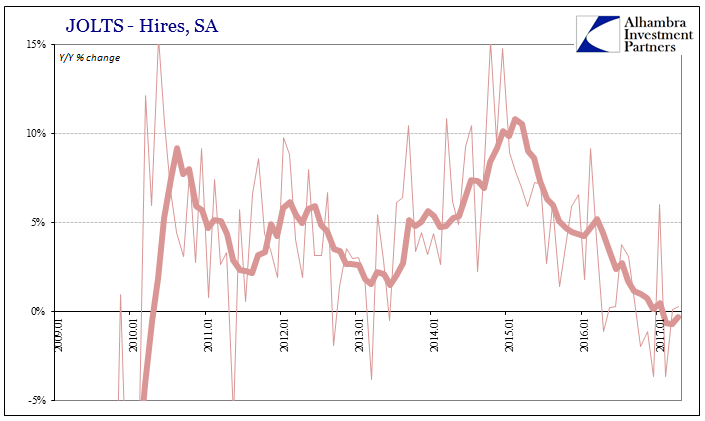 - Click to enlarge |
| Against that view, however, stands the level of Hires. Also a JOLTS data point, the BLS figures that overall hiring tanked in April. Dropping by nearly the same amount as Job Opening gained, at 5.05 million it was the lowest level of hiring activity for a single month since last April. Adjusted for population levels, it was the weakest hiring rate since August 2014. |
U.S. Hires, December 2000 - June 2017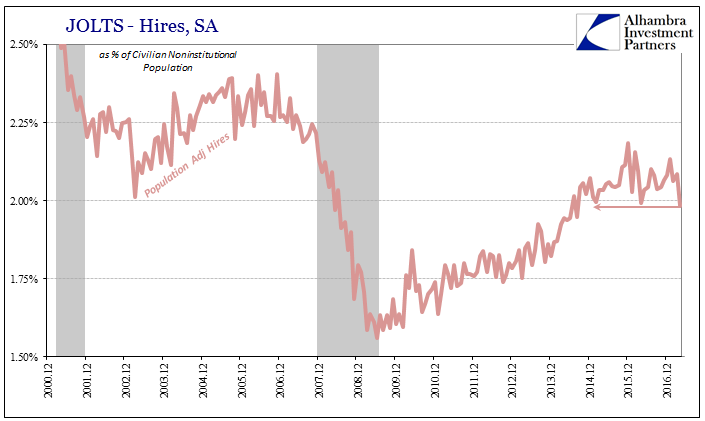 - Click to enlarge |
| The idea of a labor shortage has been introduced as a means to reconcile this growing disparity in way favorable to mainstream economics. Employers want to hire as much labor as they can, this line of thinking goes, but they can’t find enough qualified or sober Americans to do so. The level of Job Openings skyrockets in seeming desperation to fill so many open positions, while the actual filling of those positions lags far behind, leaving with it an economy that does so, too. |
U.S. Labor Shortage, December 2000 - June 2017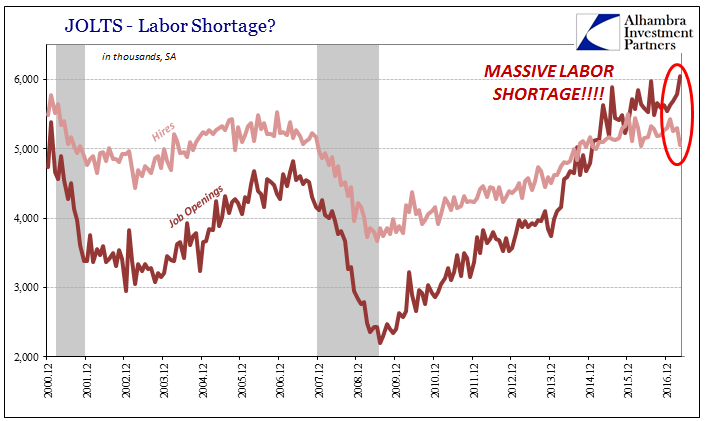 - Click to enlarge |
| If we look at the ratio of Job Openings to Hires, it becomes clear the statistics have arrived at a binary option. Either there is a massive labor shortage as is softly claimed, or the statistics like the unemployment rate and Job Openings are just plain wrong. There is at these levels of differences no longer any middle ground. |
U.S. Job Openings, December 2000 - June 2017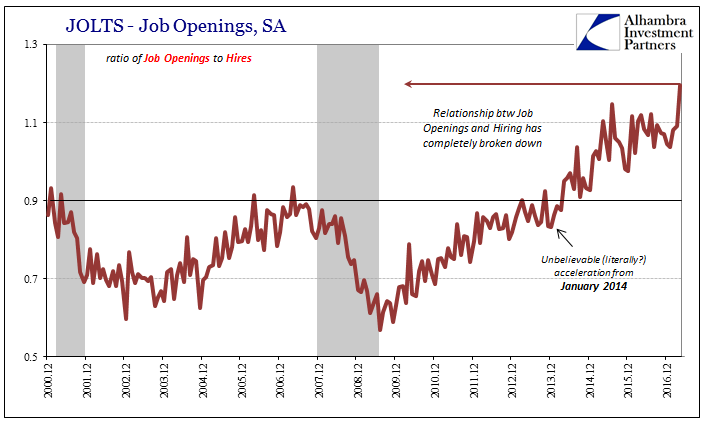 - Click to enlarge |
| This disagreement over the state of the US labor market traces back to early 2014 when all the “overheating” rhetoric got started under the unemployment rate. Though not at so much of an extreme then, the interpretation is the same throughout the whole period. It really is a matter of basic economics (small “e”). If US employers are so desperate for labor that they are posting ads in such extremes over actually hiring, then by every single reason or relationship they would be willing to pay for that labor at whatever market-clearing price could be offered. |
U.S. Average Weekly Earning, Production And Nonsupervisory, January 1999 - June 2017 - Click to enlarge |
Instead, as I wrote after the latest weak payroll report just last week:
|
U.S. Nonfarm Business Sector, January 2013 - June 2017 - Click to enlarge |
| Wages haven’t budged one bit in all those three years of this assumed shortage. The latest figures from the BLS in its Employment Cost data, including estimates for total hourly compensation, suggest in the last revisions the opposite case of a shortage. Nominal hourly compensation in the last two quarters (Q4 2016 & Q1 2017) was revised lower by a fair amount, from merely stuck to less than stuck. There isn’t the slightest hint of wage acceleration anywhere. That has included income and compensation revisions that are all of late in the “wrong” direction. |
U.S. Nonfarm Business Sector - Click to enlarge |
| We are left with no other choice, then, the inescapable conclusion that is derived from the deranged nature of these extreme levels of labor statistics. They have to be faulty and therefore highly misleading. It is not much of a stretch to claim they have been this way for all this time, just not so obviously unfounded as they are right now. The 4.3% unemployment rate does not compute properly as the denominator is beset by the participation problem (that does matter). The 6 million plus Job Openings are of a different statistical anomaly, but no less evident in its same implications. |
U.S. Nominal DPI, January 2015 - June 2017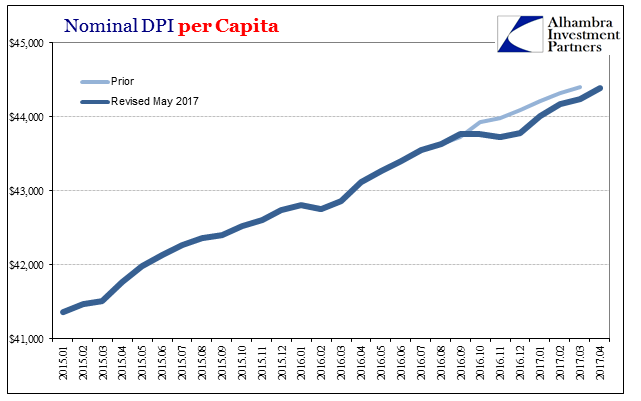 - Click to enlarge |
Full story here Are you the author?
Tags: bls,currencies,depression,economy,employment,Federal Reserve/Monetary Policy,hires,inflation,job openings,jobs,jolts,Labor Market,labor shortage,Markets,newslettersent,Unemployment,unemployment rate,wages


