Jeffrey P. Snider
My articles My offerMy siteAbout meMy videosMy books
Follow on:LinkedINTwitterSeeking Alpha
| Two more manufacturing surveys suggest sharp deceleration in momentum, or, more specifically, the momentum of sentiment (if there is such a thing). The Federal Reserve’s 5th District Survey of Manufacturing (Richmond branch) dropped to barely positive, calculated to be just 1.0 in May following 20.0 in April and 22.0 in March. It follows an all-too-familiar pattern, where sentiment spiked to start this year after being so low last year.
This is the “reflation” of so-called soft data that never quite materialized in actual economic accounts. As noted before with the Fed’s Empire State manufacturing index, it follows as if the base effect of oil prices is determining the course for all manufacturing.
|
Fed Fifth District Survey Of Manufacturing, January 2014 - May 2017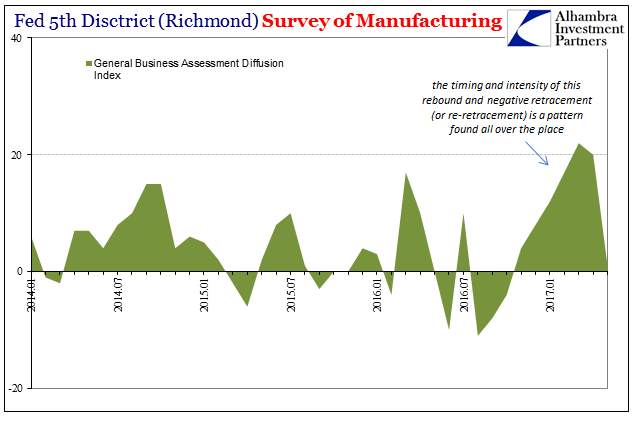 - Click to enlarge |
| The timing is a bit different depending on the specific survey, but for the Richmond version there was a clear peak in March and then like the annual change in oil prices increasingly downward thereafter. For the Empire State version, it peaked instead in February concurrent with oil, and has decelerated sharply over the last two months. |
Federal Reserve Empire State Manufacturing Index, January 2014 - May 2017 - Click to enlarge |
| The other sentiment survey from IHS Markit traces a similar pattern. The index registered 52.5 in May (flash), down from 52.8 in April and 53.3 in March. That was the lowest index level since last September. Like the others, it peaked in January and has been falling since, more so the last two months. |
U.S. Manufacturing PMI, January 2014 - May 2017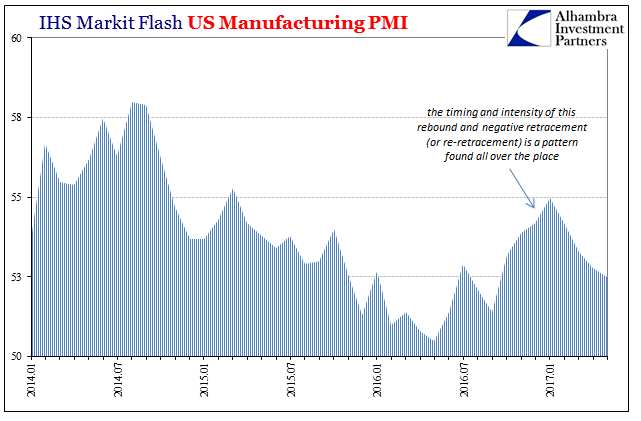 - Click to enlarge |
Comments by Markit’s Chief Business Economist Chris Williamson help explain the trend a little apart from oil.
In other words, it is more disappointment than the slightest confirmation that something, anything, might be materially different in 2017 than the very low growth climate of 2016. There is quite conspicuously lacking all economic momentum, even though just in cyclical terms there really should be quite a big evident by now after suffering a global near-recession at the start of last year. It certainly appears that, like mainstream rhetoric, perhaps manufacturers were over-interpreting the upswing from last summer forward. |
Prices Commodity Circular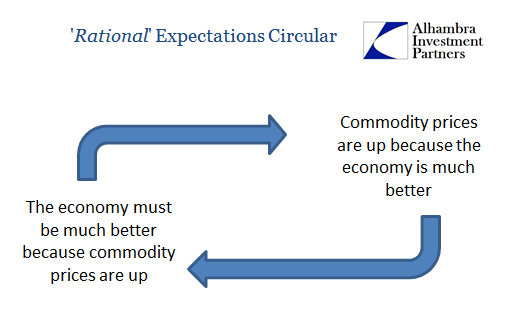 - Click to enlarge |
| I think it a more fundamental mistake, one that presumes things like commodity prices are up, or the yield curve actually steepening. They are not, as oil or copper just aren’t down as much this year as last. It should not be necessary to state the obvious, but they are down. Likewise, the yield curve is not steepening, either, as earlier this year, anyway, it wasn’t as ultra-flat as it had been last summer. |
Oil Prices, March 2011 - May 2017 - Click to enlarge |
| This may instead be a backwards accounting for recent history, how uniform it has been (see above). By that I mean for a time sentiment drew too narrow a focus, extrapolating too far into the future too much in a straight line. The dank reality of this economy would have to be reestablished at some point, so why not in the pattern of oil? The physical nature of crude pricing has always meant that though some would like to forget about all that happened over the last three years, the enormous stockpiles of black gold meant that in actual trading that never could occur. |
Copper Futures Price, January 2011 - May 2017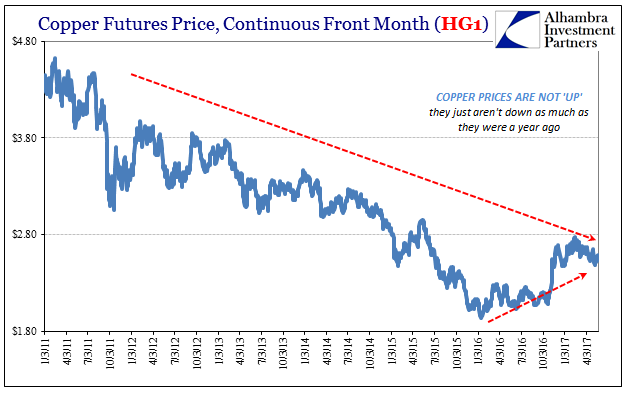 - Click to enlarge |
I think what we are seeing in many markets as well as even sentiment is resignation rather than anything more hyperbolic. It is the slow realization that nothing has really changed and more so that the chances something might go right are dwindling, or just were never all that good to begin with. The Markit commentary at least notes that this once again not unique to US considerations.
|
Broad Curve, February 2016 - May 2017 - Click to enlarge |
| “Reflation” appears to have rolled over everywhere merely because there was from the start no other realistic end for it. What really changed is that the monetary and financial pressure of the “rising dollar” ran its course, which doesn’t mean the eurodollar is now easing upward again but that we are only waiting out the interim before the next bout of pressure starts all over. |
Broad Curve, April 2008 - May 2017 - Click to enlarge |
| In other words, there is still decay, just a little less now than a year ago, the repeat from a lower state of 2014. As I have written before, the depression doesn’t end, but there are brief periods when we feel a little better about it. |
Swap Spreads And Implied Bank Capacity, February 2012 - May 2017 - Click to enlarge |
Tags: currencies,depression,dollar,economy,Federal Reserve/Monetary Policy,IHS Markit,manufacturing,Markets,newslettersent,PMI,Reflation,sentiment