Marc Chandler
My articles My offerMy siteAbout meMy videosMy books
Follow on:LinkedINTwitterSeeking AlphaAmazon
George Dorgan
My articles My siteAbout meMy videosMy books
Follow on:LinkedINTwitterSeeking Alpha
CFA SocietyEconomicBlogs
Summary:
Steep falls in gasoline and oil prices.
Large build in gasoline inventories and record refinery work shifted some surplus from oil to the products.
OPEC is expected to roll over its output cuts, but non-OPEC may find it difficult and US output continues to rise.
| This Great Graphic, made on Bloomberg, shows the past six months of oil and gas prices. The white line is the June gasoline futures and the yellow line is the June light sweet crude oil futures contract. In order to avoid showing two time series with two different scales, which often is an exercise in curve fitting, both series are indexed to start the six month period at 100.
The June oil contract is under pressure today, trading at one month lows, on news that Libya has reopened its largest oil field. However, the EIA reported yesterday that gasoline an distillate inventories rose sharply last week, while US crude output in nearly two years. Some observers suggest gasoline in leading oil lower. Gasoline inventories by the most since January. As refineries prepare for the driving season, they stepped up their activity. US refiners processed 17.3 mln barrels of crude a day, a new record. Oil inventories slid by 3.64 mln barrels, while output rose 13k barrels a day to 9.27 mln. Even if OPEC extends its output cuts, non-OPEC may balk. Recall that there were two main sources of non-OPEC output cuts. First was the natural exhaustion of fields, such as in Mexico. Second, Russia seemingly reluctantly agreed to participate. Neither seems to be recurring. Russia appears to be balking at at extending the agreement. So far this week, the June crude contract is off 1.8% after falling 7.4% last week. It will be the third week, that the price of gasoline is falling. It is off 6.1% this week so far, after a 5.2% loss last week and a 0.65% lows in the prior week. This year, gasoline prices have risen in five of the 17 weeks here in 2017. |
Gasoline Leads Oil Lower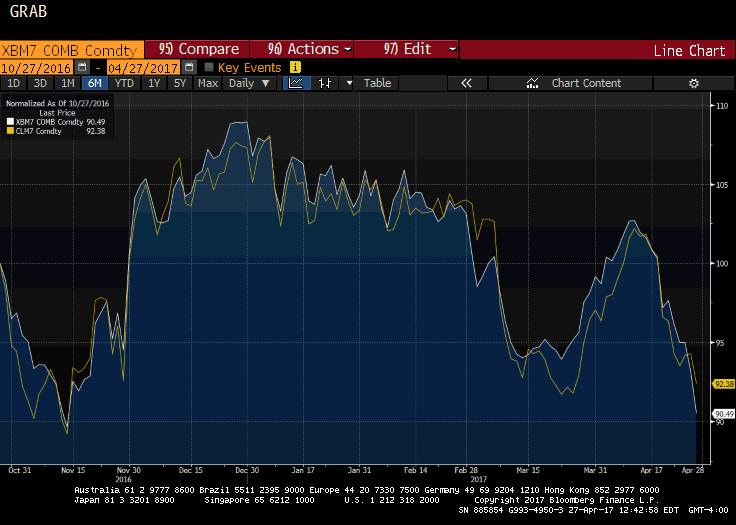 - Click to enlarge |
Full story here Are you the author?
Tags: gasoline,Great Graphic,newslettersent,OIL,oil prices