


Jeffrey P. Snider
My articles My offerMy siteAbout meMy videosMy books
Follow on:LinkedINTwitterSeeking Alpha
| Personal Income growth in February 2017 was more mixed than it had been of recent months. Nominal Disposable Per Capita Income increased 3.73% year-over-year, while in real terms Per Capita Income was up 1.57%. For the former, that was among the better monthly results over the past year, while the latter was near the worst. The difference is still calculated inflation, where the rising oil component of every deflator and consumer price index exposes the real lack of nominal gains. While 3.73% might sound impressive, it is considerably less than the more than 5% growth rates at the end of 2014 and the 4.42% average from 1995 through 2008 (which includes the dot-com recession and its aftermath). |
Real DPI per Capita, Jan 2010 - 2017(see more posts on U.S. Disposable Personal Income, )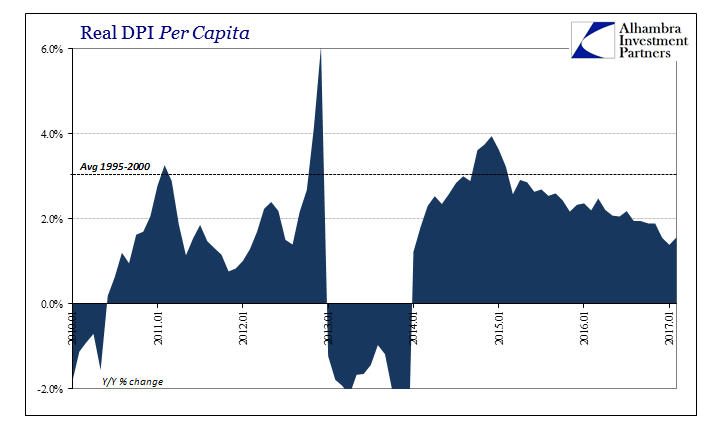 - Click to enlarge |
| Income growth has slowed over the past few years of the “rising dollar” on all terms, in all likelihood as a result of the labor market slowdown registering the overall downturn of the disturbance. As with every other economic account, personal incomes have never caught back up after the Great “Recession”, a result made from the participation problem and the constantly low rates of labor utilization. |
Disposable Personal Income per Capita, Jan 2000 - 2017(see more posts on U.S. Disposable Personal Income, )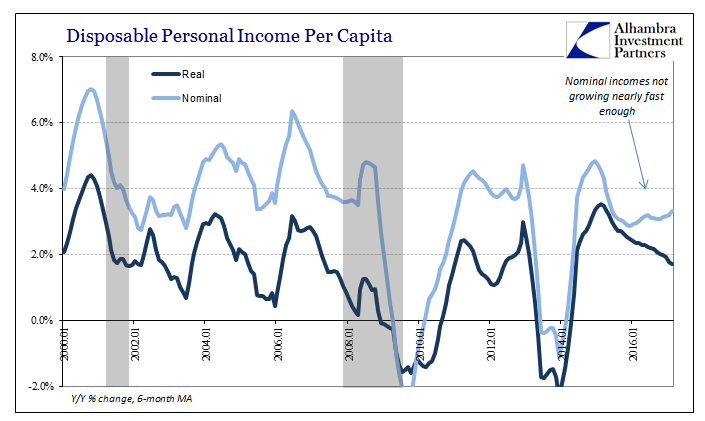 - Click to enlarge |
| The lack of momentum for income growth solves the inflation side, as if it needed such clarification, and is a constant reminder of how “full employment” at this juncture in economic history is nothing like full employment. The closer the unemployment rate got to 5%, the more incomes appeared to decelerate, not because one related to the other, rather due to nothing more than the coincident timing of the falling unemployment rate under the “rising dollar” economy. It demonstrates nonetheless the misguided nature of the unemployment rate to meaningful to analysis. |
GDP Corporate Profits CF Real DPI, Jan 1991 - 2016(see more posts on corporate cash flow, U.S. Disposable Personal Income, )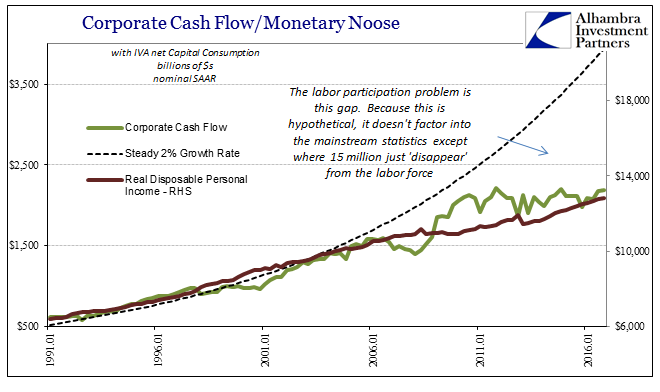 - Click to enlarge |
| Among the more studied economic accounts the NBER uses to try to determine cyclical peaks (recession call) is Real Personal Income excluding Transfer Receipts. It is a measure of income weighted more in those cyclical terms because it excludes things like welfare and unemployment payments that tend to be procyclical (part of the so-called stabilizers). What we find here is not impending recession but rather the same familiar pattern that is worse than a business cycle. |
Real Personal Income, Jan 2010 - 2017(see more posts on U.S. Disposable Personal Income, ) - Click to enlarge |
| Incomes only ever fall further behind even though, again, they have never rebounded from 2008-09. There just isn’t any positive randomness, where you would expect in a healthy economy that incomes would experience both above-trend as well as below-trend periods. Over the last ten years, there have only been negatives, where all deviations have resulted in incomes falling farther behind than they already were previously. |
Real Personal Income, Jan 2010 - 2017(see more posts on U.S. Disposable Personal Income, )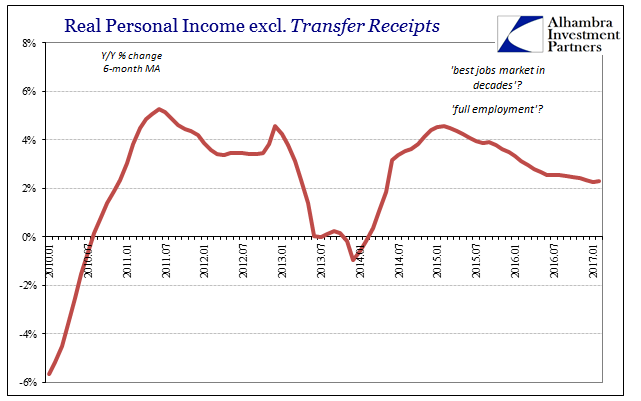 - Click to enlarge |
| That was the case for the near-recession to start 2016, where in terms of Real Personal Income the slowing of inflation rates at that point (the ultimate low of the oil crash) wasn’t enough to offset the dramatic shutdown in nominal incomes. The result is what you see above, where the trend was altered to start last year and even with favorable revisions during 2017 clearly remains off. But because nominal incomes have slowed relative to 2014, even the gentle revisit of inflation is enough to for a second time push Real Personal Income further off-trend. |
Real Personal Income, Jan 2013 - 2017(see more posts on U.S. Disposable Personal Income, )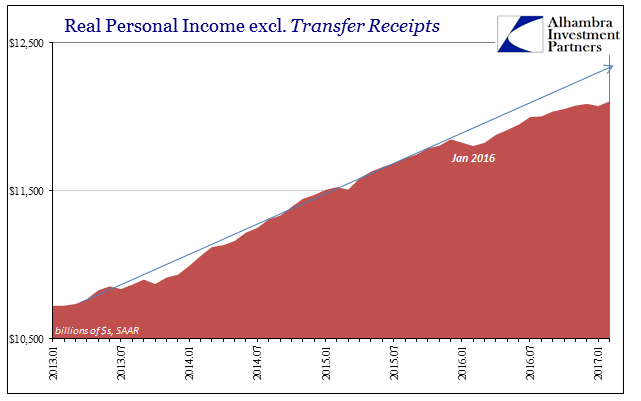 - Click to enlarge |
| The total deviation is not huge, but it needn’t be to have an effect. Going back to 2009, the problem isn’t that Real Personal Income excluding Transfer Receipts should be $12.4 trillion (SAAR) rather than $12.1 trillion, to be consistent with the post-2012 pattern, or even that it isn’t closer to $18 trillion or better, but that it is always getting weaker despite this state. There is no meaningful improvement no matter what, such as in 2014 which was supposed to be the start of “liftoff” toward “overheating”, or again in 2017 after having avoided a possibly worse condition last year this time. The default setting always seems to be negative.
Without a sustained infusion of income growth, and a sizable one, the US and global economy is stuck in this state. It is as simple as that. Income is the true basis for sustainable and sufficient growth, and without the debt supplementation of the last decade the decrepit root for the 21st century eurodollar economy is revealed for that (permanent) state. |
Disposable Personal Income, Jan 1985 - 2017(see more posts on U.S. Disposable Personal Income, )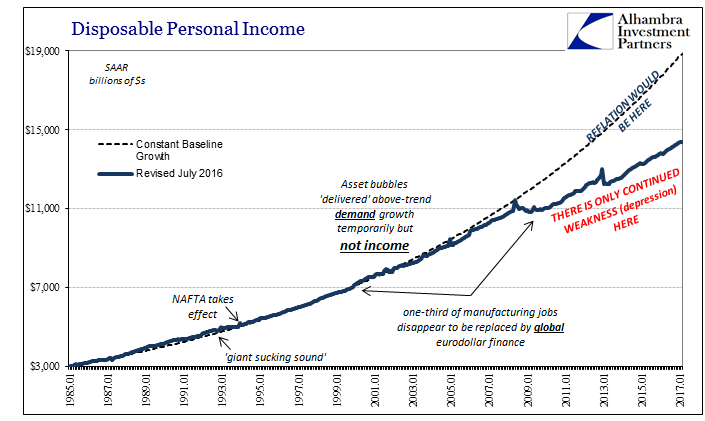 - Click to enlarge |
Jeffrey P. Snider is the head of Global Investment Research of Alhambra Investment Partners (AIP). Jeffrey was 12 years at Atlantic Capital Management where he anticipated the financial crisis with critical research. His company is a global investment adviser, hence potential Swiss clients should not hesitate to contact AIP
Tags: corporate cash flow,currencies,earnings,economy,Federal Reserve/Monetary Policy,inflation,jobs,Labor Market,Markets,newslettersent,U.S. Disposable Personal Income,wages


