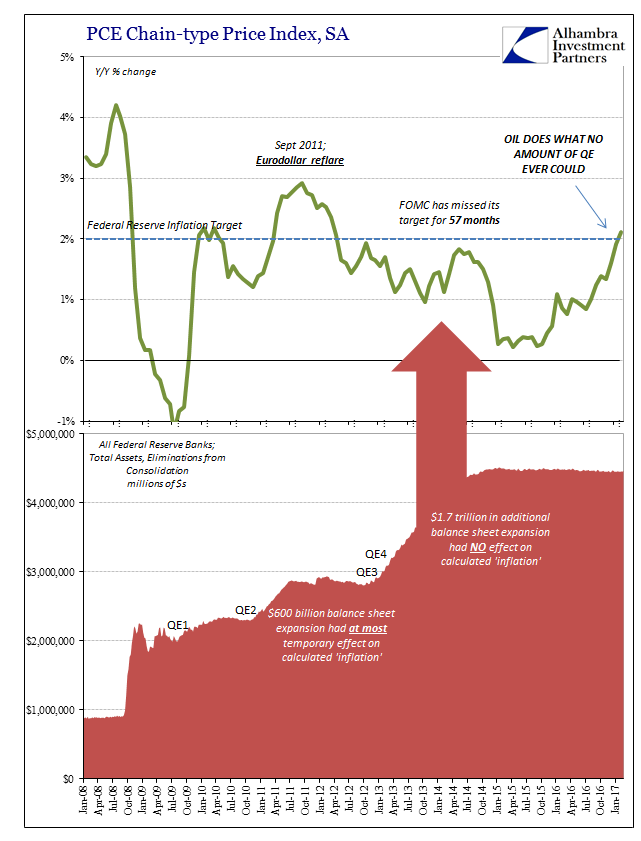
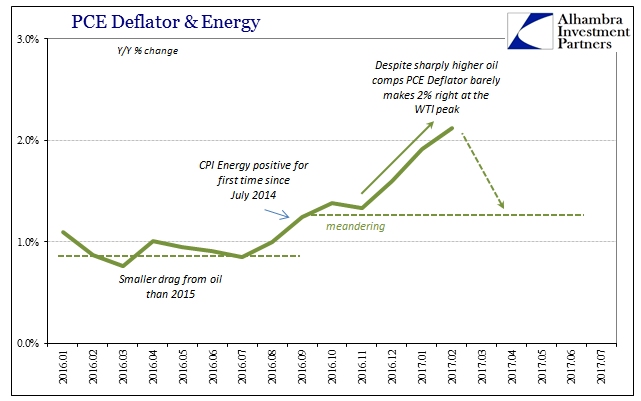
| For the first time in 57 months, a span of nearly five years, the Fed’s preferred metric for US consumer price inflation reached the central bank’s explicit 2% target level. The PCE Deflator index was 2.12% higher in February 2017 than February 2016. Though rhetoric surrounding this result is often heated, the actual indicated inflation is decidedly not despite breaking above for once. In many ways 2.12% is hugely disappointing, at least for policymakers and those in the media cheering them. For consumers there is no good amount of inflation.
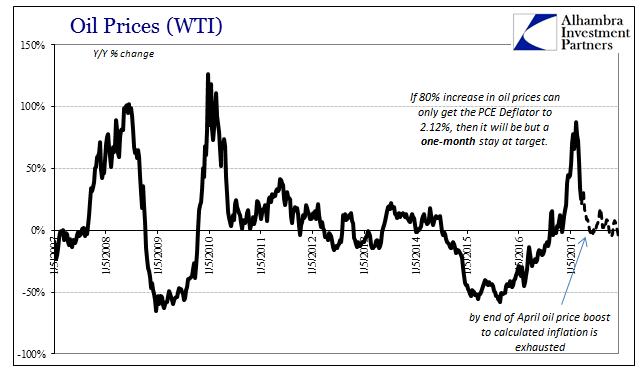
If it took a nearly 80% rise in WTI just to generate calculated inflation barely above the target mark, then nothing really has changed. As the base effects of oil pass into history, so will the Fed’s chance to claim success in the one place where “money printing” should make all the difference. Instead, it was the “dollar” working through oil prices that moved inflation and will keep doing so, leaving WTI the only thing that matters and monetary policy as it has been for a very long time – irrelevant. |
Oil Prices WTI, May 2007 - 2017(see more posts on oil prices, ) |
| Unless something has radically changed during March that hasn’t yet been published or caught any attention, the PCE Deflator’s “success” in February will be the only month for that condition. For an exact preview of what to expect four weeks from now, we need only turn to Europe whose inflation data is one month ahead. |
SA PCE Deflator Fed(see more posts on pce deflator, ) |
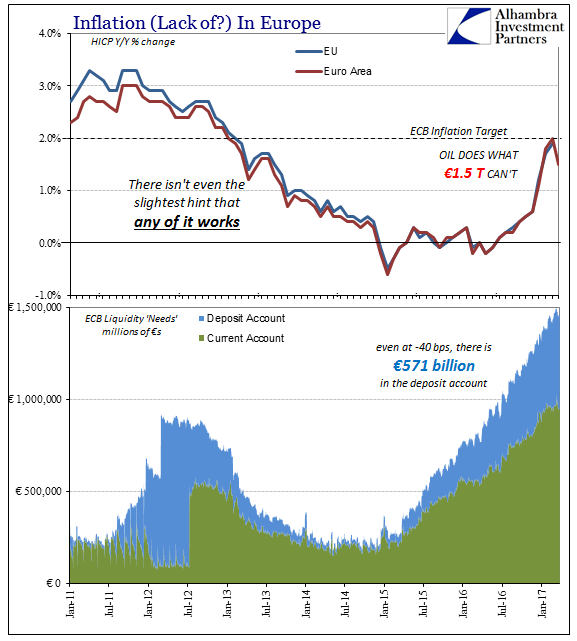
| Like the PCE Deflator, Europe’s HICP (Harmonized Index of Consumer Prices) rate registered the 2% target level in February for the first time in a very long time (48 months). And like the Fed, the ECB had undertaken a considerable amount of “stimulus” and even QE (and then expanded QE) which was expected to change the inflation trajectory. Instead, it was only oil prices that delivered the ECB its brief 2%, and then promptly took it away in figures released also today. |
Eurozone PCE Deflator, Jan 2011 - 2017(see more posts on pce deflator, ) |
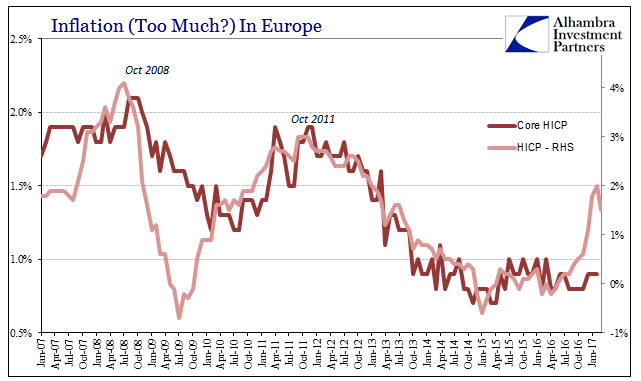
| The calculated HICP was just 1.5% for March 2017, considerably less than expected because in the mainstream economists still actually believe QE is working and will continue to over time. The major surveys of economists had expected inflation to decelerate only to 1.8% this month, and steady itself from there on for the rest of the year. Thankfully, from the point of view of beleaguered consumers, QE isn’t working and plays no role in setting consumer prices.
In all likelihood, once the calendar moves beyond the oil price base effects inflation for both Europe as well as the US should settle back to where it was during much of last year. At around 1.1% to 1.5%, it will be more embarrassing disappointment to policymakers on both sides of the Atlantic. As I wrote earlier today:
Inflation moves in the US as it does in Europe, where one is doing QE and the other having stopped several years ago. In other words, it doesn’t matter in the slightest whether there is or is not QE (and the rest of “stimulus”), an almost perfect experiment to further establish what we long ago already knew. |
US Core PCE Price Index, Jan 2007 - 2017(see more posts on U.S. Core PCE Price Index (PCE Deflator), ) |
| It’s a serious blow to “reflation” even for those more rational in their belief of it, those who realized that it was oil prices not rebound pushing up, temporarily, inflation rates. The fact that the PCE Deflator will very likely perform as Europe’s HICP already has demonstrates again that there is no actual difference in economy this year versus last year, no detectable momentum to propel meaningful economic growth. The only improvement is the relative change where the economy in the second half of 2016 and the first quarter of 2017 isn’t actively retreating like it was toward the end of 2015 and the beginning of 2016.
That is, in the end, all that oil prices are reflecting, a good representation of the economy as a whole. Though they were up about 80% during February, WTI like the US and global economy was still at that level down considerably from just a few years before. That’s what needs to change in the whole economy, and like inflation all over the world there is just no indication that it has or even that it might. |
US Core PCE Price Index, Jan 2016 - 2017(see more posts on U.S. Core PCE Price Index (PCE Deflator), ) |
Tags: CPI,currencies,depression,dollar,ECB,economy,EuroDollar,Europe,Federal Reserve,Federal Reserve/Monetary Policy,hicp,inflation,Markets,money printing,newslettersent,oil prices,pce deflator,QE,U.S. Core PCE Price Index (PCE Deflator),WTI


