See the introduction and the video for the terms gold basis, co-basis, backwardation and contango.
Probabilistic Technical Analysis vs. the Mechanics of ArbitrageWe talk about the supply and demand fundamentals every week. We were surprised to see an article about us this week. The writer thought that our technical analysis cannot see what is going on in the market. We don’t want to fight with people, we prefer to focus on ideas. So let us compare and contrast ordinary technical analysis with what Monetary Metals does. Technical analysis, in all of its forms, uses past price movements to predict future price movements. In some cases (e.g. momentum analysis) it calculates an intermediate signal from the price signal (momentum is the first derivative of price). But no matter the style, one analyzes price history to guess what the next price move will be. This is necessarily probabilistic. There is no way to know that a particular price move will follow the chart pattern you see on the screen. There is no certainty. And when it does work, it is often due to self-fulfilling expectations. Since all traders have access to the same charts, and the same chart-reading theories, they can buy or sell en masse when chart signals them to do so. We are not here to argue for or against technical analysis. We simply want to say that it’s not what we are doing – not at all. Our analysis is based on different ideas. The key idea is that there is a connection between the spot and futures market. That connection is arbitrage. Think of each market as a platform that moves up and down on its own vertical track. The two tracks are close together. And the platforms are connected to each other by a spring. Suppose platform A is a bit above platform B. If you push up on A, then the spring stretches a bit more and will pull B up, though perhaps not as much. The same happens if you push down on B. Conversely, if you push down on A, then it will compress the spring and platform B will tend to go down, though not as much. A and B are the futures and spot markets for gold (the same analogy applies to silver). Arbitrage works just like a spring. If the price in the futures market is greater than the price in the spot market, then there is a profit in carrying gold — by buying metal in the spot market and selling a futures contract. If the price of spot is higher, then a profit is to be made by de-carrying — by selling metal and buying a futures contract. There are two keys to understanding this. One, when leveraged speculators push up the price of gold futures contracts, then that increases the basis spread. A greater basis increases the incentive for the arbitrageur to take the trade. Two, when the arbitrageur buys spot and sells a future, the very act of putting on this trade compresses the spread. If someone were to come along and sell enough futures contracts to push down the price of gold by $50 or $150 or whatever amount is alleged, then this selling would be in futures only. It would push the price of futures below the price of spot, a condition called backwardation. Backwardation just has not happened at the times when stories of big “smash downs” have made the rounds. Monetary Metals has published intraday basis charts during these events many times. The above does not describe technical analysis. It describes physics — how the market functions at a mechanical level. There are other ways to check this. If there was a large naked short position in a contract that was headed into expiry, how would the basis behave? The arbitrage theory predicts a basis move in the opposite direction. We will leave the answer out as an exercise for the interested reader, as thinking this through is really good work to understand the dynamics of the gold and silver markets (and you can Google our past articles, where we discuss the topic). This can be checked every month, as either gold or silver has a contract expiring (right now it is gold, as the April contract is close to First Notice Day). |
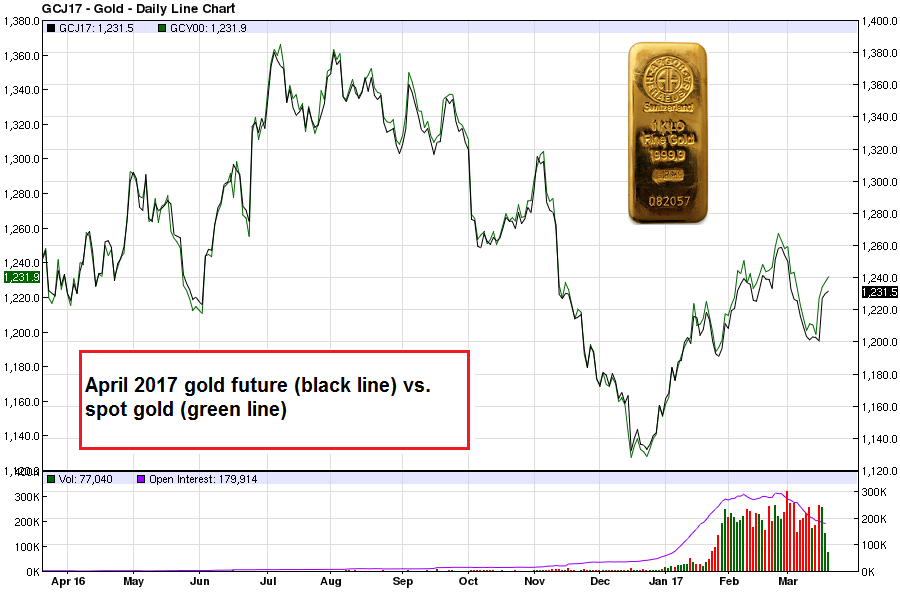
Gold Future April 2017 |
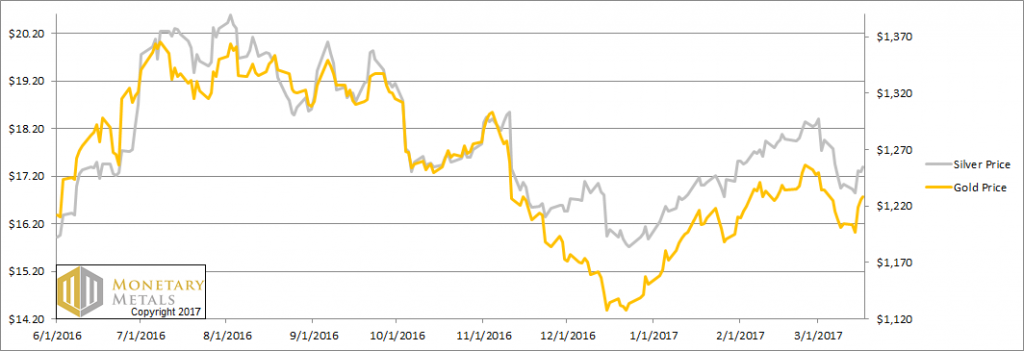
Fundamental DevelopmentsThis week, the prices of both metals rose. The price of gold is almost back to where it was in the prior week, but that of silver is not. Below, we will show the only true picture of the gold and silver supply and demand. But first, the price and ratio charts. |
Gold and Silver Prices(see more posts on Gold and silver prices, ) |
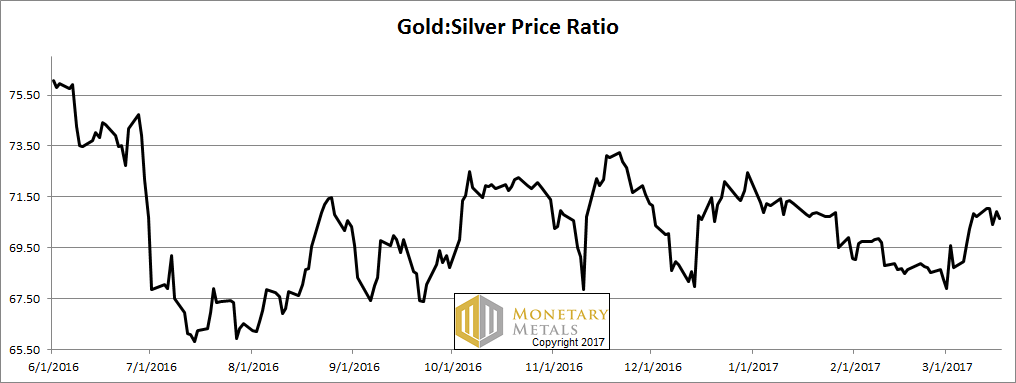
Gold:Silver RatioNext, this is a graph of the gold price measured in silver, otherwise known as the gold to silver ratio. It moved sideways last week.
|
Gold:Silver Ratio(see more posts on gold silver ratio, ) |
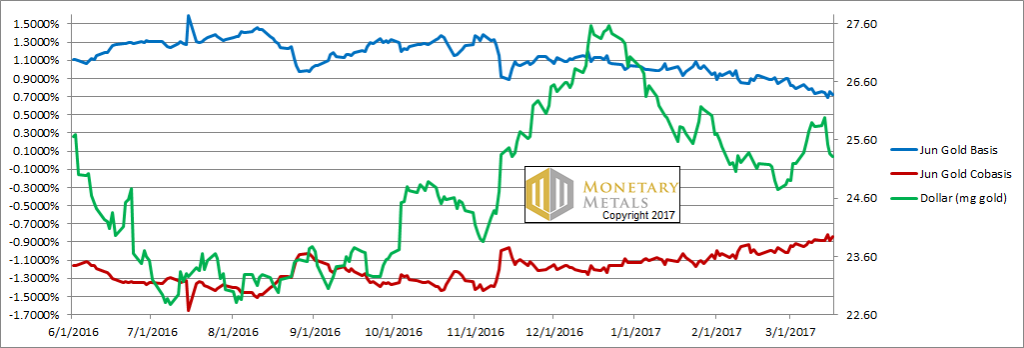
Gold Basis and Co-basis and the Dollar PriceHere is the gold graph. NB: we switched from the April to the June gold contract. As the price of the dollar fell (inverse of the rising price of gold, measured in dollars) we saw the co-basis (our measure of scarcity) increase a bit. This means the buying in gold, which pushed up the price, was buying more of physical gold rather than of futures contracts. This seems to be the new pattern of late, though it is sputtering a bit, like an engine trying to start up and run at a steady RPM. Our calculated fundamental price of gold is up nearly $50. It is now over $1,400. |
Gold Basis and Co-basis and the Dollar Price(see more posts on dollar price, gold basis, Gold co-basis, ) |
Silver Basis and Co-basis and the Dollar PriceNow let’s look at silver. The story was the same in silver. A rising price accompanied by rising scarcity. The silver fundamental price rose 50 cents. It is now about $1.30 above the market price. |
Silver Basis and Co-basis and the Dollar Price(see more posts on dollar price, silver basis, Silver co-basis, ) |
Charts by: BarChart, Monetary Metals
© 2017 Monetary Metals
Full story here Are you the author? Previous post See more for Next post
Tags: dollar price,Gold and silver prices,gold basis,Gold co-basis,gold price,gold silver ratio,newslettersent,Precious Metals,silver basis,Silver co-basis


