Jeffrey P. Snider
My articles My offerMy siteAbout meMy videosMy books
Follow on:LinkedINTwitterSeeking Alpha
| The last time oil inventory grew at anywhere close to this pace was during each of the last two selloffs, the first in late 2014/early 2015 and the second following about a year after. Those events were relatively easy to explain in terms of both price and fundamentals, though the mainstream managed to screw it up anyway (“supply glut”). By and large, the massive contango of the futures curve that showed up as a result of “dollar” conditions made it enormously profitable to pull crude out of current flow and deposit it wherever storage might be available, even at some considerable cost (so steep was the contango). It was the symbolic intersection between economy and finance which told the world there was nothing good about those times. |
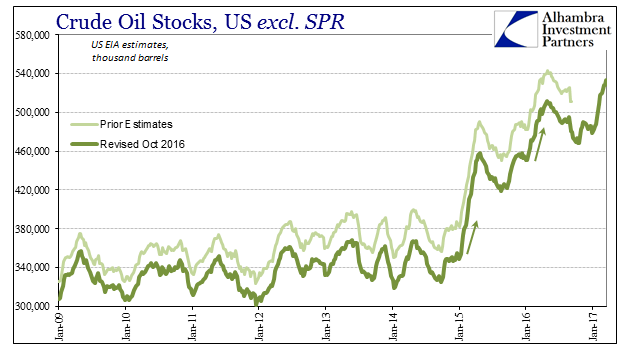 . |
| This time, however, there is only minor contango in WTI (or Brent) futures and a curve that isn’t much changed over the last year. And still crude is pouring into Cushing at an alarming rate, so much so that by earlier this month oil investors started to leak out of the over-crowded long trade. You have to believe that the unusually steady price of WTI from mid-December forward despite almost everyone being long was related to this once again gaining imbalance – no matter how hard you try to fashion “rate hikes” into a much more robust future economy there is this very visible degree of caution that cries out “not so fast.” |
NYMEX WTI Futures 2016-2020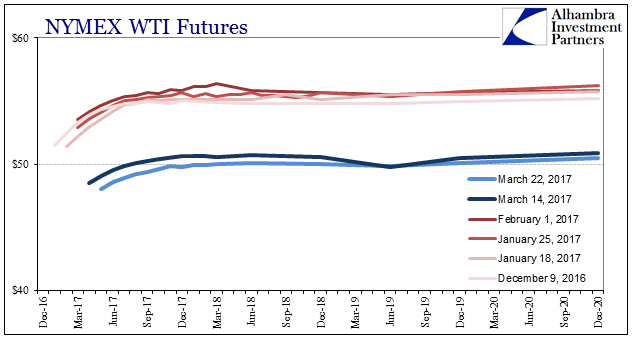 - Click to enlarge |
| Again, the scale of the inventory increase forces its way into the oil conversation no matter how optimistically predisposed you may be (or might have been). According to the US EIA, since the week of January 20 the reported level of oil stocks rose by more than 44 million barrels (through the week of March 17). To put that into perspective, over the same eight weeks in 2014 oil inventories rose by just 24 million barrels (seasonal accumulation) and by only 19 million in 2013. By contrast, 60 million barrels went to inventory during those weeks in 2015 and 38 million last year, the two big selloffs. |
Oil Prices (WTI) 2016-2017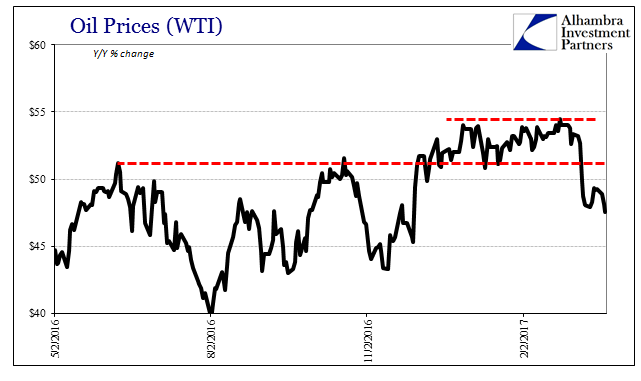 - Click to enlarge |
| We know right where a good part of this inventory accumulation is coming from:
Gasoline inventories were unusually high all throughout last year based on crack spreads that made it profitable for refineries to run some of the oil through-put into gasoline. As noted on a prior occasion, the reason those spreads were high was the same mistaken economic belief that equates “rate hikes” with “better economy.” |
Gasoline Stocks US 2016-2017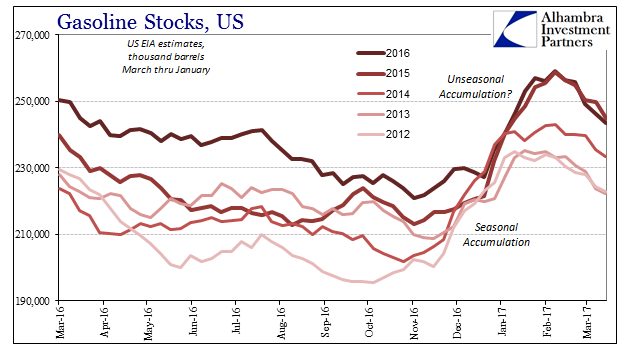 - Click to enlarge |
Crack spreads started late last year to crack (pardon the pun), again according the US EIA. Small wonder given that the actual economy isn’t truly different to start 2017 than it was to start 2016 under conditions of near-recession. Crack spreads were investors dreaming of an economy that might be now running into the reality of one that still is. Because of that, what was being diverted into gasoline in the hopes of being sold as gasoline is now being left to fill up whatever additional storage in oil already at record levels. |
Gasoline Stocks US 2016-2017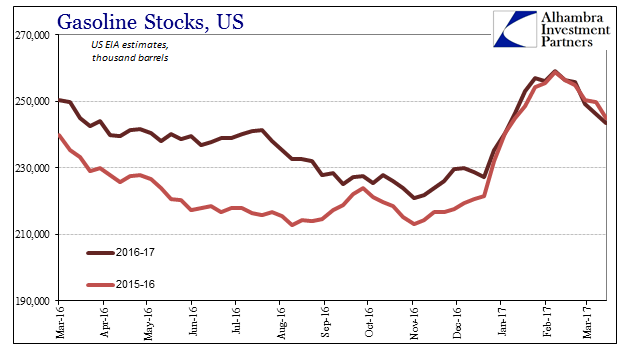 - Click to enlarge |
| It makes for an unusually appropriate bookend of sorts, where fundamental supply and demand noted in 2015, for those open minded enough to see it, that “something” was very wrong. Now on the other side in early 2017, it is left to oil inventory to once more proclaim “something” is still very wrong. And it isn’t now, just as it wasn’t then, supply. |
RBOB futures price and crack spread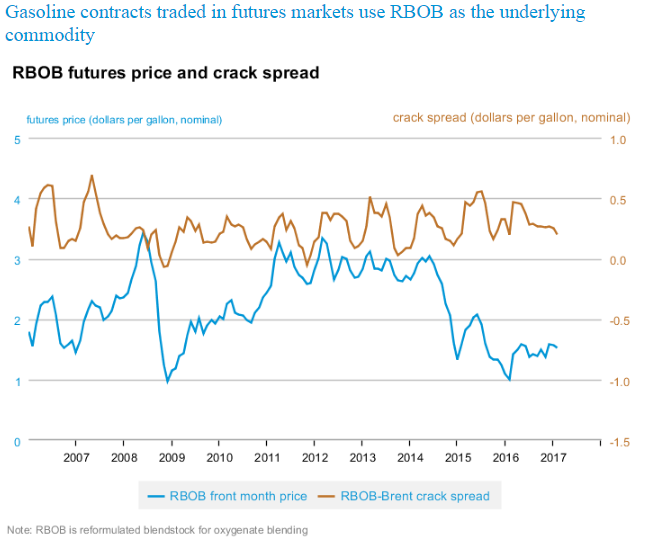 - Click to enlarge |
Tags: commodities,contango,currencies,dollar,economy,EuroDollar,Federal Reserve/Monetary Policy,gasoline,Inventory,Markets,newslettersent,OIL,oil prices,WTI,wti futures curve