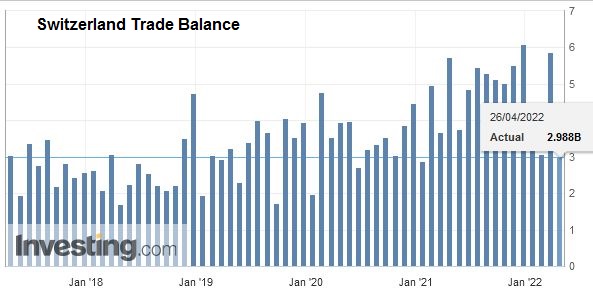
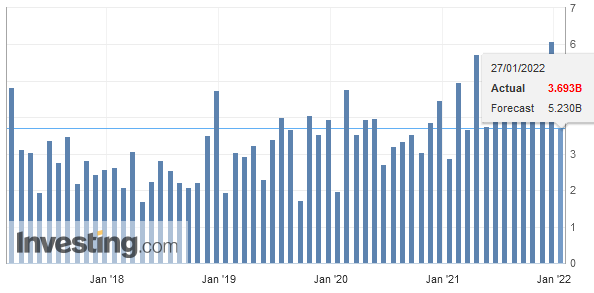
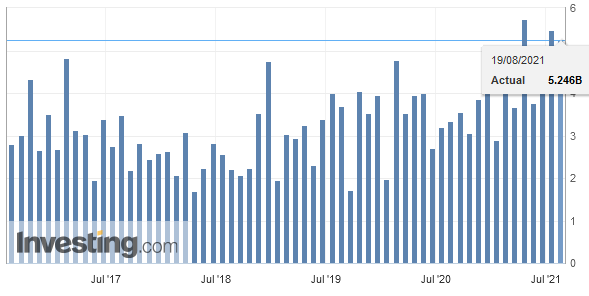
We do not like Purchasing Power or Real Effective Exchange Rate (REER) as measurement for currencies. For us, the trade balance decides if a currency is overvalued. Only the trade balance can express productivity increases, while REER assumes constant productivity in comparison to trade partners.
On the other side, a rising trade surplus may also be caused by a higher savings rate while the trade partners decided to spend more. Recently Europeans started to increase their savings rate, while Americans reduced it. This has led to a rising trade and current surplus for the Europeans.
To control the trade balance against this “savings effect”, economists may look at imports. When imports are rising at the same pace as GDP or consumption, then there is no such “savings effect”.
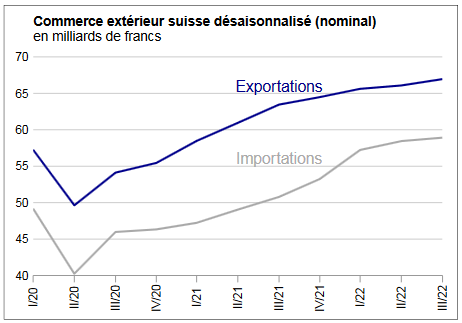
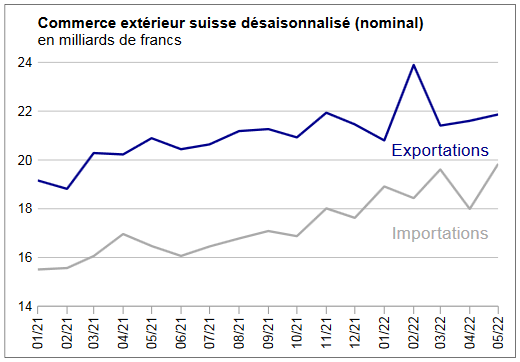
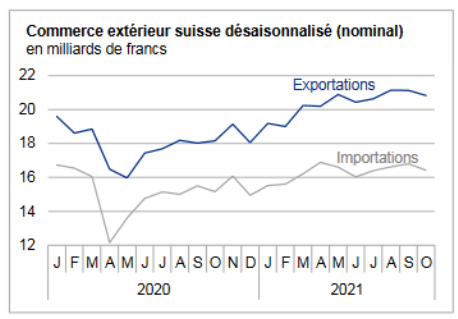
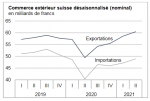
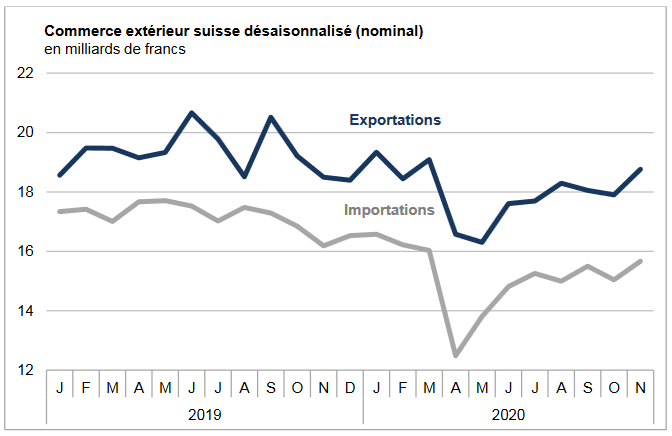
Charts from the Swiss customs data release (in French).
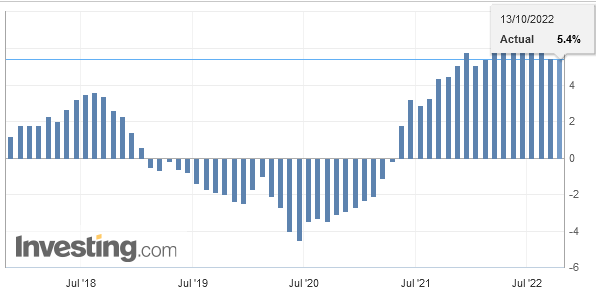
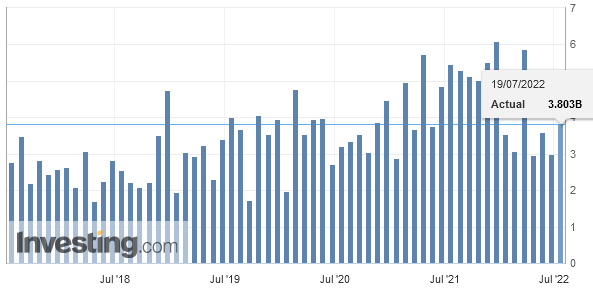
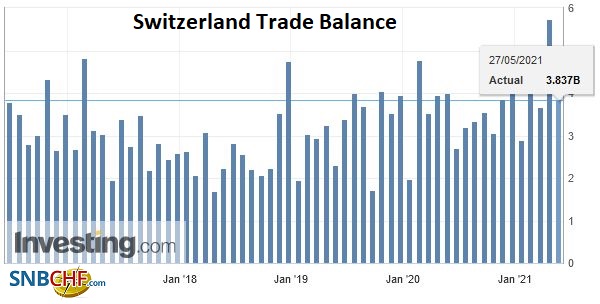
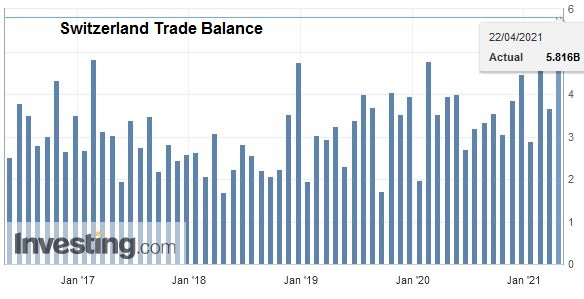
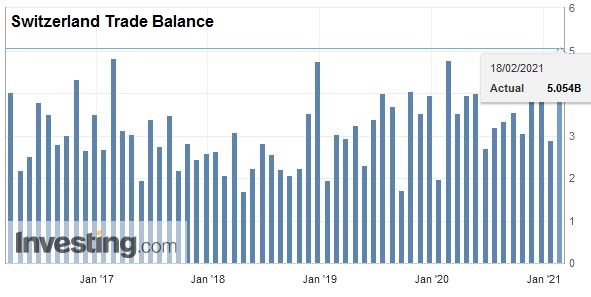
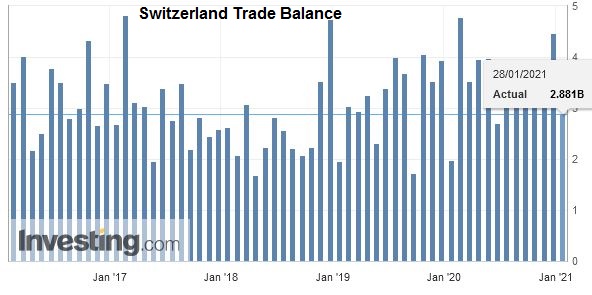
Exports and Imports YoY DevelopmentAfter adjusting for working days, exports increased by 5.3% (real: +2.3%) in January 2017, boosted by chemicals and pharmaceuticals. Imports, on the other hand, fell by 1.2% (real: -6.8%). The trade balance loops on a record monthly surplus of 4.7 billion francs. In short: ▲ Exports: record month for chemicals – pharma (9 billion francs) ▲ One-quarter jump in exports to North America ▼ Exports excluding chemicals – pharma down 5% ▼ Watchmaking Exports: 3rd worst result since August 2012 |
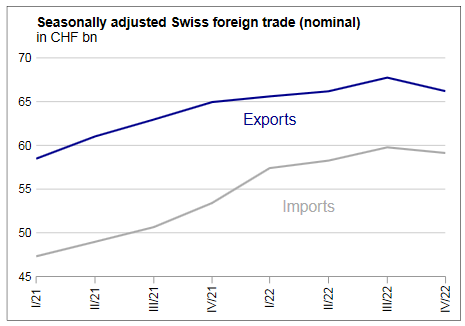
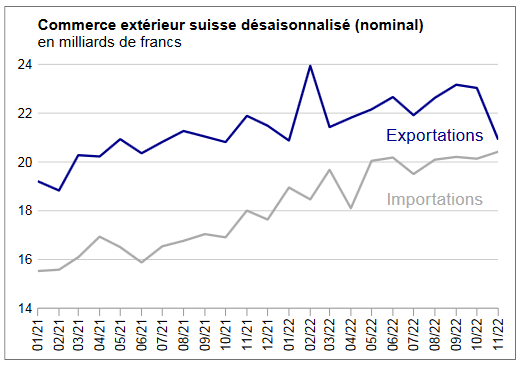
Swiss exports and imports, seasonally adjusted (in bn CHF), Jan 2017(see more posts on Switzerland Exports, Switzerland Imports, )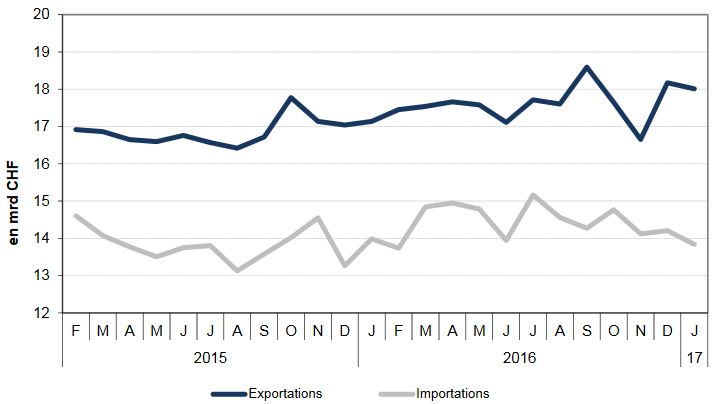 Source: Swiss Customs - Click to enlarge |
Overall EvolutionIn January 2017, adjusted exports of working days rose by 5.3% (real: +2.3%). Compared to December 2016 and seasonally adjusted, they nevertheless declined by 0.9% (real: -4.0%). Despite the volatility of recent months, outflows cling to their slight positive trend started in the third quarter of 2015. Imports lost 1.2% year on year and even 6.8% in real terms. Over a month (seasonally adjusted), the decline was 2.6% (real: -5.3%). Entries continue to sink since mid-2016. |
Switzerland Trade Balance, Jan 2017(see more posts on Switzerland Trade Balance, ) Source: Investing.com - Click to enlarge |
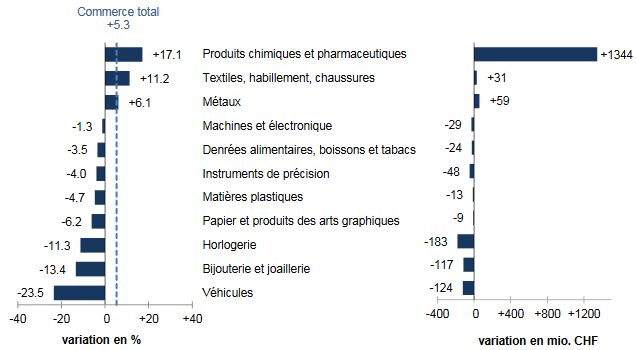
Exports: +771 million francs for medicinesExport growth was driven exclusively by the dynamism of Chemicals and pharmaceuticals (+ 17% or +1.3 billion francs). Excluding this sector, they are down 5%. Pharmaceuticals jumped by 26% (+771 million francs) and immunological products by 18% (+407 million). The textile, clothing and footwear sector grew by 11% (merchandise in return) versus 6% for metals. Number two in exports, the machinery and electronics sector has continued the saw-tooth trend of recent months (-1%). Watchmaking, the third largest exporter with 1.4 billion Swiss francs, did not halt the bleeding (-11%). Jewellery and jewellery plunged by 13%. The biggest decline is nevertheless to be put on the account of vehicles, falling by 24% (aeronautics: -146 million francs). The business market has enjoyed diverse fortunes on the three main continents, strongly influenced by the evolution of pharma products. Shipments to North America climbed 23% (USA: +620 million francs). In Austria (+ 4%, EU + 3%), Austria and Belgium rose by + 17%, followed by Germany (+ 12% respectively +380 million francs). Conversely, the United Kingdom lost 14%. The Asian market is contracted as a whole. Saudi Arabia (-43%) and the United Arab Emirates (-28%) contrasted with the flight to China (+ 28%). |
Swiss Exports per Sector January 2017 vs. 2016(see more posts on Switzerland Exports, Switzerland Exports by Sector, ) |
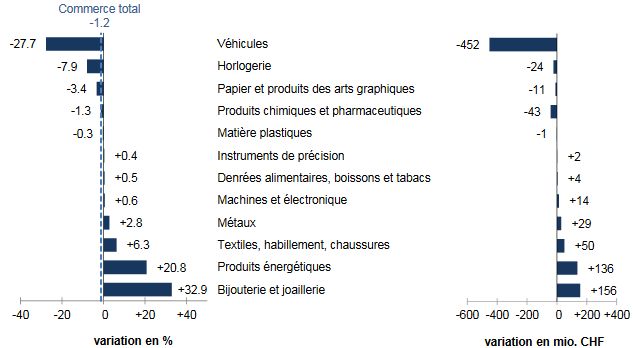
Aircraft pull imports in red numbersImports (-1%) widened in January 2017: while vehicles fell by 28% (-452 million francs), jewellery and jewellery rose by a third (+156 million). Between these two extremes, five groups out of twelve showed a variation between -1 and + 1%, including both chemical-pharma heavyweights as well as machinery and electronics. In the vehicle sector, the strong decline was due to the number of airliners imported during the month of comparison. Chemicals and pharmaceuticals were down slightly (-1%). Besides jewellery, the textile, clothing and footwear (+ 6%) and energy products (+ 21%) sectors have evolved to the right side of the bar. In the latter, the increase is due solely to the surge in prices; In real terms, these products decreased by 5%. While European shipments took the lift (+ 2%), those of the other main continents suffered. Imports of North American origin thus plunged by 23%, leaded by the USA (-28%, among other airliners). The Asies fell by 1%. Here, the contraction of 12% for China opposed the rise of Singapore (+ 68%); For both countries, chemicals and pharmaceuticals played a major role. Europe showed a contrasted face. France (+ 8%, jewellery and electricity) and Germany (+ 6%) had a smile, while Ireland (-26%) and the Netherlands (-13%) grimaced.
|
Swiss Imports per Sector January 2017 vs. 2016(see more posts on Switzerland Imports, Switzerland Imports by Sector, ) |
Full story here Are you the author? Previous post See more for Next post
Tags: newslettersent,Switzerland Exports,Switzerland Exports by Sector,Switzerland Imports,Switzerland Imports by Sector,Switzerland Trade Balance


